Lifetime Gitcoin Grants Data Analysis and Hypothesis Testing

Lifetime Gitcoin Grants Data Analysis and Hypothesis Testing

This report is a submission for the Gitcoin Bounty: analyze lifetime Gitcoin Grants Data Rounds -12 | gitcoinco Funded Issue Detail | Gitcoin | Gitcoin.

Summary

A drastic increase in the Gitcoin Matching Pools in Round 12 has not been close to any of the rounds historically.
The Gitcoin Platform successfully catches opportunistic behaviour in changing grant to a larger matching pool.
With the new matching pool strcuture in GR12 users have decided to not mention their region. North American grants have dominated the Gitcoin platform and Africa has been neglected.

On the technical side:
We have cleaned the dataset optimizing for the Gitcoin dataset and Gitcoin in particular. We have also provided an open-source code in Python that can be used for production.

Introduction

To understand how we can use the data to maximize its utility for the community at large and for decision makers in Gitcoin community, first we have researched the Gitcoin forum posts and the Quadratic Formula.

The posts for Reference:

Following these posts we outlined the areas of research that could be explored with the given data:

  • The distribution patterns in the Gitcoin Grants data, for example, correlations between crowdsourced funding + matching to regions, grant category.
  • The effect of changes in matching pools structure prior to GR12 and some insight into the changes that came up with GR12 one pool.

We also provide an account of the peculiarities of the given data such as missing values.

Structure of the report

First we provide an overview of the Gitcoin rounds data. Then, we deal with the technical side of working with data: filling in the missing values, correcting for artifacts and feature engineering.

The code is open-sourced and available on kaggle at

We have also uploaded the dataset on kaggle at GRallRounds | Kaggle

Data Cleaning and exploratory data analysis

Rounds 1-12 Matching Pools and pot sizes

In the rounds data we have noticed that besides the official Gitcoin Rounds data includes the rounds data of its partners. Therefore, as the title of the bounty states 12 rounds we left only GR data and the partners rounds counted in the dataset as the GR.

GR data has the most common name of a matching pool in the data is ‘all’ since Gitcoin Core team (rounds 1-5) and later in consultation with the Funders League (rounds 6-9) has made more centralised decisions on the matching relative to the current state of governance.

The second most common occurring round is Infra, Dapp and Community which took place from 7 to 11 round. Nft is the third most common value of the pot.

One of the notable developments in the round 12 was diffusion of the previous structure of matching pools and a trajectory towards one large single pool. Hence, on the graph above we do not see the common categories in round 12.
In the granular data we noticed that instead of the traditional matching pools that OG Gitcoin users likely got used to, the names have switched to “Uniswap”, “Polygon”, “ZkTech” among other names. To qualify for such pools the grants need to be in one of the 6 categories such as “dGov” or “dApp” and co-operate with the partner.
The new grant structure also introduced the new pools such as “Longevity” and “Climate Change” that have stricter qualifying requirements.
In total in round 12 this led to the historically largest amount of unique grant pools - 9. In part due to the amount of partners and available matching funds.

Rounds 1-12 Granular data missing values

To begin with, we visualize the missing values to find interesting patterns:

We can see that the column with the most missing values is crowdfund. On the more detailed analysis we find that rows with missing crowdfund values all contain zero unique contributors, which is very interesting. Some ideas on the underlying pattern: the owner of the grant contributing to the grant, error in data logging or a returning contributor.

1

We also find that the rows that have nan for total have nan for crowdfund and therefore contain little useful information. In proportion its 15% of the total rows that we drop from the dataframe.

2

Exploring Gitcoin Detection of opportunistic behaviour

Next, it was particularly interesting to explore the patterns among the unique grants across time.
After we cleaned the data we found that the number of unique grants is 1886.
Personally, I was really interested in exploring the adaptation behaviour in changing the grant region and category and how often that has occurred per grant_id.
To my surprise less than 0.1% of the grants have been involved in such behaviour that we know from the data. Besides, most of actions that changed region involved actually mentioning the region for the first time.

3

In turn, the grant_id is also connected to the same category across time and Gitcoin has successfully disabled such opportunistic behaviour.

Nevertheless, We decided to test the hypothesis that Gitcoin historically enables changing the grant details if the owner creates similar grant with new details. We assumed that the same grant title might be connected to the same grants. The number of such grants is 44.
On more detailed analysis we evaluated the changed details and it appeared to not be connected to the gaming the system since none of the detailed in the dataset were changed.
Therefore, we are confident that Gitcoin has historically caught opportunistic behaviour in adapting the same grant for more favourable matching pool.

Regions across time and Continent EDA

From the data, the most common region is none meaning that users in most of the cases decided not to mention the region out of the available options.

4

It is also interesting that none has coincided with the type of the round and whether there was a pool for a region. Notable that such grants received relatively low amount of matching funds, likely attributed to the Gitcoin penalizing this behaviour.

We also find that the mean total raised funding per grant per round favours Oceania and North America and neglects Africa and Asia to some extent.
5

In fact, by capita NA is a strong favourite in terms of the raised funding.

We have also build an interactive map available at GTC_map | Kaggle

Moreover we explore the interaction between matching and the total for category and region variables for Round 11.

In Round 11 the over-subsidized region was Africa while under-subsidized was Middle East.
8

While for a category dGov was the most subsidized while dApp and Comms were not favoured by QF.
9

8 Likes

Correlations Analysis

We have further conducted correlations analysis and found relatively strong relationships between these variables:
6

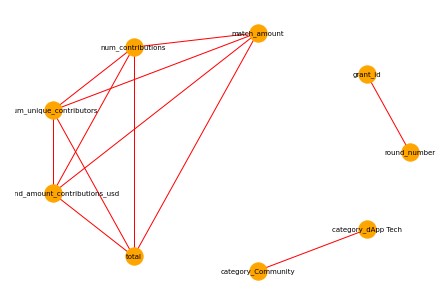
Interesting Findings:
There is negative low correlation between grant round and match_amount, meaning that as time passes the matching amount decreases
7
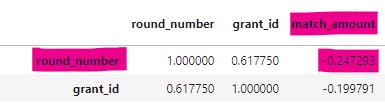
Also a similar relationship between grant_id and match_amount. Since new grants have higher number, the new grants are likely to get lower funding.

For the observation with region none there is a negative somewhat mild correlation -0.35 with the number of unique contributors. For this region it is also notable that it has negative correlation of -.27 with total funding raised. However, very similar region undefined has a positive correlation of .17 to total.

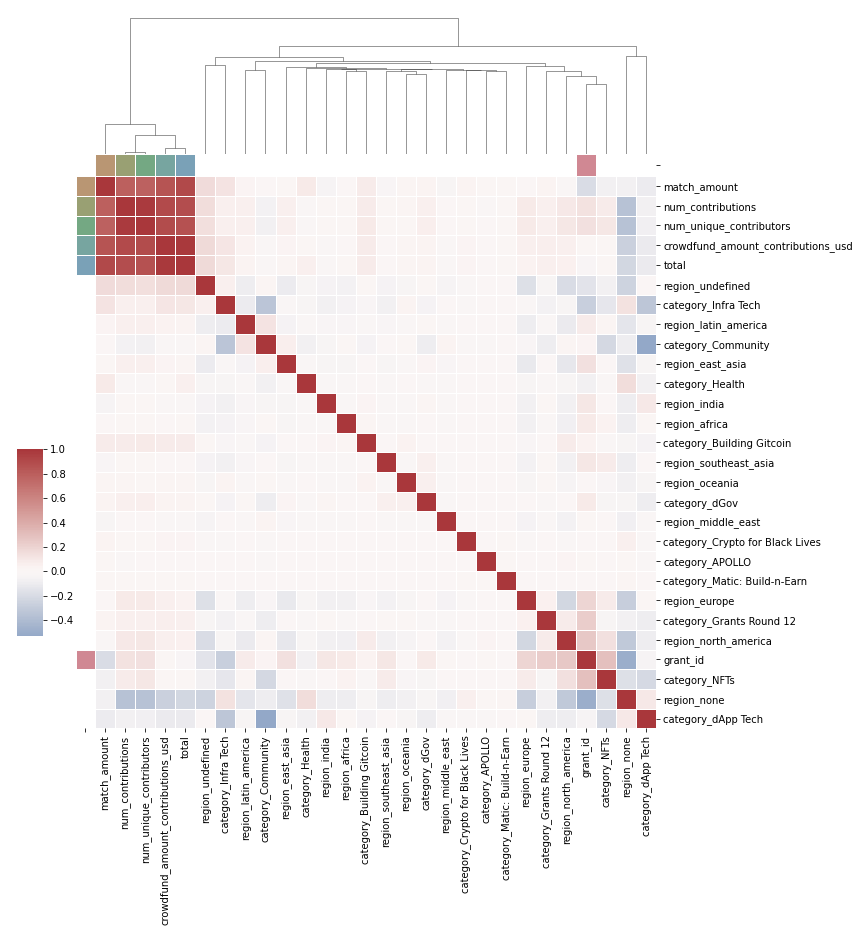
The structured heatmap for the variables is as follows:
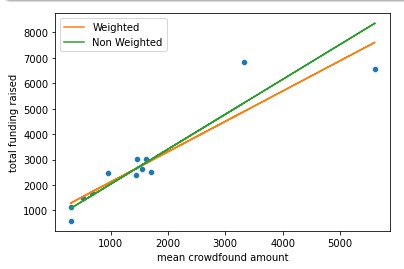
Modeling

We modeled grouped by round and weighted by count of unique grants. We found that on weighted average a mean contribution of 1$ per grant would result into $660 total funding per average grant.
10
11

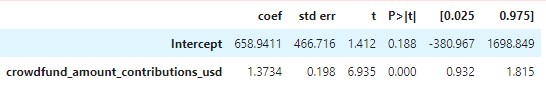
In turn, when we add another parameter - average number of unique contributors per round, we get coefficients and results that demonstrate the value of a large amount of unique contributors and the crowdsourced funds:

image

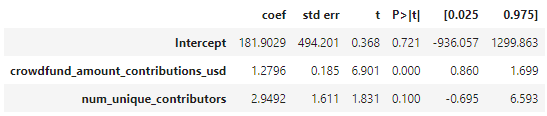
For instance, if only 1 person donates 1$ to each grant, the grant owners would get around 185$ per grant. But if 1000 people donate a sum that would be equal to .001$ to each available grant, an average total raised per grant would be around 3130$.
In round 12 there were 882 such grants, hence each of the 1000 would only need to spend 80 cents.

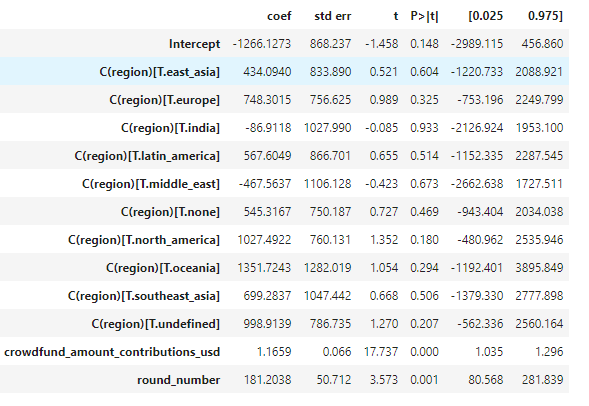
Next we group by region as well as round and weight by the number of unique grants.
Since we found that mean_crowdfund is highly significant we will include dummies for each region except one to avoid bias. In addition we include the number of grant round to estimate the effect of the trend.

We find that the most penalized region is Africa followed by Middle East.
image

Synthetic Controls

The effect of the separating Africa in GR11 as its own matching pool.
image

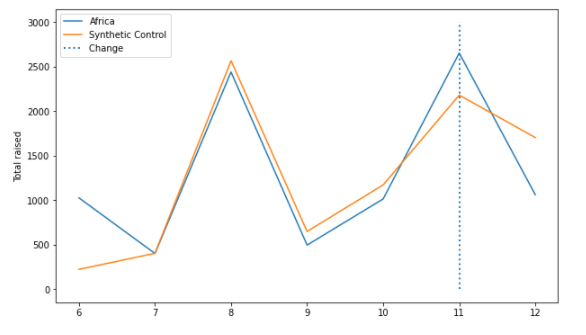
The initial effect of the policy seems to have an immediate positive impact on the Africa in GR 11, but a large negative effect in round 12.

8 Likes

Really great work here! I’m loving lawrence idea to package up all the best insights and continue to deliver the analysis each round

6 Likes

Yes, nice work @Pfed-prog!

To a large extent on the correlation analysis + the modeling part.
It could be great to have a cloud clustering of different mapping as well but this is just an addon.

2 Likes

@Sirlupinwatson Do you mean adapt to Gitcoin pipeline? I am pretty sure that i’ve accomplished exactly what was possible with the given data. I think there is a misunderstanding on how hard is actually to clean this data. Personally, I would prefer to not work with similar Gitcoin dataset in the future. But I definitely made life easier for further applications.

2 Likes

@DisruptionJoe I would prefer not to be inlcluded in the meta-report. If my prize depends on the inclusion in the meta-report, please, do not send it to me.

2 Likes

No, all I am saying is that you made a great analysis. And I like the second part (Correlation + modeling)

2 Likes

Thank you very much for this unique analysis!

3 Likes

Really great to get such a positive response from a policy analysis expert. Means a lot, cheers.

4 Likes

Thank you for sharing this great effort.

1 Like