An Interactive Model for Gitcoin Revenue Growth Forecasting

TL;DR

This post will:

  1. Share the results of our revenue survey
  2. Share an interactive model for forecasting revenue growth (w/ raw survey data)
  3. Discuss the high and low ranges for revenue growth
  4. Discuss the variables with the highest impact for the lowest effort

Sustainability of Gitcoin is a hot topic. There is discussion around protocol fees, service offerings, and even mutual grants or investment potential. Then there is the gnarly conversation around GTC utility.

@nategosselin , a product manager and workstream lead in GPC, had a great presentation at the community call a few weeks back discussing how the entire DAO should be focusing on protocol growth to maximize fees, thus bringing us to a point of sustainability.

PGF is considering service fees as a way for program managers to become self-serviced if not willing to pay for white glove service levels. @kyle has written about MMM & FDD potentially spinning out service entities in this article: [Discussion] Gitcoin 2023 - Future Essential Intents and Organization - #9 by michaelgreen06. Scott laid out guidance by suggesting we all remember a subtraction mindset here. The community has sparked some great conversations with these must read gems: A BULL/BEAR case for Gitcoin/GTC in 2023 & GTC TAM/SAM/SOM analysis & GTC Financial Model

I’ve participated in this sensemaking as well hosting a community call where we worked on a Miro to dig into the areas of disagreement. You don’t have to look at my past post for long to find discussions about our business strategy and sustainability. I have also suggested that one option for DAO sustainability is to invest in workstreams that provide services. While these workstreams wind down their reliance on Gitcoin and become sustained by profit, they would have generous agreements for continued funding of the protocol of which they are dependent. Maybe through Aqueducts? These are all ideas.

With all of these divergent thoughts and ideas, we decided to release a new survey to build upon our understanding of revenue and sustainability which started with this Polis survey. We wanted to find out what reasonable growth would be for protocol usage. Forecasting of revenue derived from protocol fees and services would make it possible to find a range for expected revenue.

Revenue Survey Results

The survey we conducted polled Gitcoin core contributors asking for their opinions on a few questions about potential growth & revenue. This was only polled internally for the purpose of limiting the responses to known entities possessing experience working on quadratic funding.

As we share the results we will also set a number that seems reasonable to use for projections based on our survey results. These are the numbers reflected in the image at the top of the article.

It seems safe to say the average matching pool will be $100k

While most people think the donations will continue to outpace the matching funds, we will use 120%. This means if a matching pool is $100k, then the individual donations for that round would be $120k adding up to a total Gross Marketplace Value (GMV) of $220k for the round.

If we have 10 rounds in season 1, then how many rounds do we expect in season 2? Here it shows that a reasonable expectation might be 40%. (In the model this is entered as 140%)

The best part of this graphic is that the waves behind each question show how many people set their marker at each position. We can see that “Protocol Fees - Paid by program manager had slightly more people vote in the “kind of agree” than in the “strongly agree” area. You can also see that many more people were neutral or kind of in support of “GTC Utility - Staking to Review Grants / Users” than were against it though less were strongly in agreement.

FYI - I am making up the “Kind of” agree terminology as the markers could be set in 5 places. Strongly disagree being the 1 spot and strongly agree is the 5 spot. 3 is neutral. Therefore, I’m calling spots 2 and 4 “kind of” disagree and agree respectively.

This and another question you can see in the results presentation aren’t used to set parameters for the model in discussion.

Some people being against a protocol fee for donors makes me stay in the lower range of the most popular answer. We will set 3% in our example model.

How about we split it down the middle at 3%?

For our last variable, let’s go ahead and set it at 7%.

Now, just for fun, you can take a look at the word cloud that came out of the exercise!

An Interactive Revenue Growth Forecasting Model

Here is a link to the model which you are welcome to copy.

High and Low Ranges for Revenue Growth

To start, the variables were set using these numbers in our survey results above. The model named “Mid-100k” uses the values in the image below.

For this range evaluation we will return to the survey results. We will adjust all the variables to unrealistic levels where ALL the variables deliver at a lower or higher rate. In reality, it is unlikely for all of them to be low or high as some will be a point of focus and are likely to improve while others will wane.

These comparisons are on the “Range Forecast” sheet. This first image shows seasonal revenue growth over 5 seasons without changing the assumption that we have an average matching pool size of $100,000 with 10 rounds to start.

This shows the potential for Gitcoin to be sustainable while maintaining the current burn rate by mid 2024 in a high growth environment. Is that likely? I don’t know! That is why I made the model so you can input variables the way you see the potential.

The “Low-100k” model uses a randomly (read: closest whole number I chose) variable levels in the bottom quartile of responses while the “High-100k” sets the variables in the top quartile using the most optimistic responses. No adjustments are made to the baseline assumptions of 10 rounds to start with an average matching pool of $100k.

When we adjust the average matching pool size along with the low and high growth scenarios, it gets quite out of control quickly!

This is showing the seasonal revenue potential, not the cumulative earned at that point. For example, in our high growth scenario keeping the baseline at $100k for the average matching pot, we could bring in $44 million in the July season of 2025, then follow that with $77 million 3 months later another $135 million!

Obviously, this is a fairly naive model which purely looks exponential growth without any flattening of the growth curve. Don’t @ me for this an other trivial issues like “hey Joe, we aren’t going to get that revenue in the first beta round!” Feel free to just push the start dates back!

Which Levers Have the Highest Impact Potential for the Lowest Effort & Risk

Lastly, I’d like to present a framework for thinking through where our efforts are best spent. To do this, I will baseline using the same growth variables and baselines. For each variable, I will assess the impact in seasonal revenue potential when we get to July of 2025.

This naive representation gives me a $ value Impact Expectation for a controlled change in a variable. I then can sort them vertically in an Impact x Feasibility matrix.

I then assessed the feasibility of each and thought a bit about the risk as well.

  • Cost vs Revenue Scaling: Linear vs non-linear
  • Risk: Likelihood of increases to lose GMV
  • Risk Volatility: Can we gently approach the risk level through experimentation

DAO warning - these were all my own subjective opinions! Here are some of the ways I thought about each lever.

Donor Funds as a % of Matching Funds

  • Cost vs Revenue Scaling: Maybe scales non-linearly through branding and tools to help program managers market their rounds better
  • Risk: Mostly opportunity cost of not improving higher impact levers
  • Risk Volatility: Very Little

Service Fee Revenue %

  • Cost vs Revenue Scaling: Linear
  • Risk: As we depend on service revenue, more DAO funds are allocated to the services growth than Gitcoin ecosystem public goods - open source software, data, analysis, research, and education.
  • Risk Volatility: Moderately high - Once the path is set, it is hard to convince people to vote against their own interest

Growth Rate of # of Rounds

  • Cost vs Revenue Scaling: Non-linear - Plus, more rounds means more donors!
  • Risk: Lower average round size - The round size distribution is likely to resemble a Pareto curve more and more as the ecosystem develops. MetaQF could be an answer for not only positive-sum round growth, but also bending economic gravity in a way that increases average round size.
  • Risk Volatility: Very little

Program Fee Revenue %

  • Cost vs Revenue Scaling: Non-linear
  • Risk: Forking! The program fee may be part of the UI or the protocol. Either way, the higher it is, the more likely someone is to fork.
  • Risk Volatility: HIGH! Once one org forks the UI and/or protocol, it will make it exponentially easier for other matching pool funders (program managers) to choose to use a non-Gitcoin option. This creates an event horizon where there is no turning back from this decision!

Donor Fee Revenue %

  • Cost vs Revenue Scaling: Non-linear
  • Risk: Very low - Donors are not likely to have the resources and expertise to fork the UI or protocol. (Although our users are more likely than most out there!) I also assume that most wouldn’t mind a small percentage being given to support Gitcoin!
  • Risk Volatility: Low - Experimentation at the UI level with individual rounds and/or within programs allows us to test how much is reasonable before broader application of fees at the protocol level.

Conclusion

I hope this tool and analysis is helpful. As we move forward, I would love to see more data-driven growth techniques used to make decisions. High level metrics based on highest potential levers can catalyze a symbiotic relationship between contributors and token holders. They can also paint a picture of what is possible and why we are doing what we are doing.

Special thanks to FDD’s @SoD for thinking through some of this with me. Also, to everyone who has been participating on the forums and in community calls and keeping an open mind while we explore possibilities.

PS: I’d love to add the baseline averages for each metric from the last 4 rounds, but I got tired…

8 Likes

Awesome analysis. kudos @DisruptionJoe and @Sor03

2 Likes

Thanks @DisruptionJoe .

This is interesting. Much simpler than the model I put together, and arguably more accurate because it’s based off the data from the Polis survey. All of that makes it more solid foundation to tune assumptions for revenue!

I went ahead and made a copy of the model with some new metrics and also tuned some parameters. You can get my copy here.

Changelog:

  • All of my changes are tracked in red and blue (
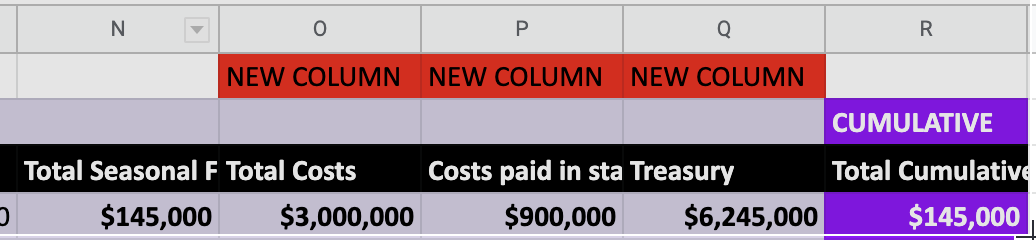
  • Added the ability to track spend (GTC and stables spend) and the size of the treasury (I think this is important bc if the treasury hits 0 that is a sign of trouble).

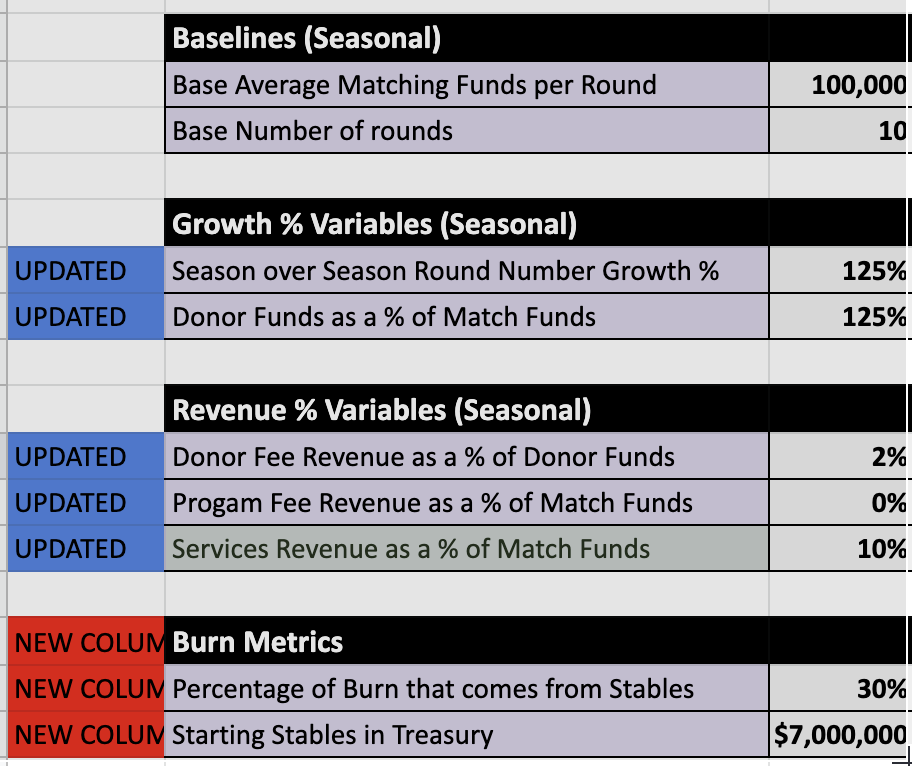
  • Updated Growth %s to be more realistic and revenue % to be more realistic.

These are the core KPIs in my forked model.

  1. Assumes $3million/season in spend, 30% from stables and 70% from GTC.
  2. Stablecoin Treasury (total revenue - total expenses in stablecoins > $0) reaches all-time-low of $2.6 million in mid-2025 with 60 rounds/season at total $13,411,045 in seasonal GMV.
  3. Profitable (total revenue - total expenses in all tokens > $0) in mid-2026 with 227 rounds/season at total $51,159,077 in seasonal GMV and $3,296,918 in seasonal revenue.

Future changes to make the model more complete:

  1. Track Mutual Grants
  2. Track GTC in treasury, on market, and locked in staking.
  3. Passport Considerations
1 Like

I’ve updated this model per @J9leger request to add costs and Tiers of service.

Feel free to make a copy and do whatever you like!

3 Likes