GitcoinDAO’s Fraud Detection and Defense (FDD) workstream continues to refine its vision and evolve in its concerted efforts to actualize and achieve its top-level aim. This has been the driving force behind the workstream, which has resulted in the formation of numerous teams to carry out its goal.
DAOs are primarily managed by the community, and because they are a trust-based system, we must have adequate feedback loops in place to ensure their longevity or alignment with their vision. Accessing actions and determining whether or not they are progressing in a healthy manner, as well as whether or not their paths are aligned with the organization’s overarching aim, can create those feedback loops. Even though weekly connections and conversations keep the community up to date, we might need a faster and more precise way for the time-constrained stakeholders to look over the status. It can be achieved by having the right metrics and defining their thresholds. With FDD, it was also necessary that these escalations are inherently automated in nature, to reduce time-based errors because of the sensitivity of the processes or data dealt with by FDD.
Due to the complexity that DAOs bring them within inherently, and at the same time trying to be organizationally leading as well as to take contributor satisfaction at its best is a challenge in itself. So the metrics that we define for such orgs should be able to capture this complexity and dynamism by maintaining qualitative vs qualitative real-time approaches for the same. Collecting the data is easy in any tech org, but the process of understanding what data matters? How to report it so that it is important and precise for all stakeholders and defining context for them in this huge ecosystem is important to understand the impact on any level.
Mandate delivery as one of these squads in season 13, is saddled with the task of delivering evaluation metrics of the FDD core workstreams- GIA and Sybil- and effectively simply communicating its discoveries to engage the GitcoinDAO community.
Although the groundwork for this squad was laid in S12 itself under the research initiative, and in collaboration with Token engineering as few of our contributors were in a research program to study the sustainability of rewards systems and understand overall DAO health or even how to make grants flow more efficient for long term sustainability.
GRANT INVESTIGATIONS AGENCY (GIA)
The grant investigations agency (GIA) consisted of 5 squads, all working towards the scalability and legitimacy of the grants. The challenge with GIA was that the system needs to have the right scaling solutions in place, and at the same time maintain the right balance between privacy and transparency between all of the actors.
Approach:
The first thing before we got started on the metrification of the process flow was to understand all of the proceedings with the GIA working group. Based on what had been defined for the S13 as objectives and key results (OKRs) for these specific squads were going to be the base for understanding the overall direction.
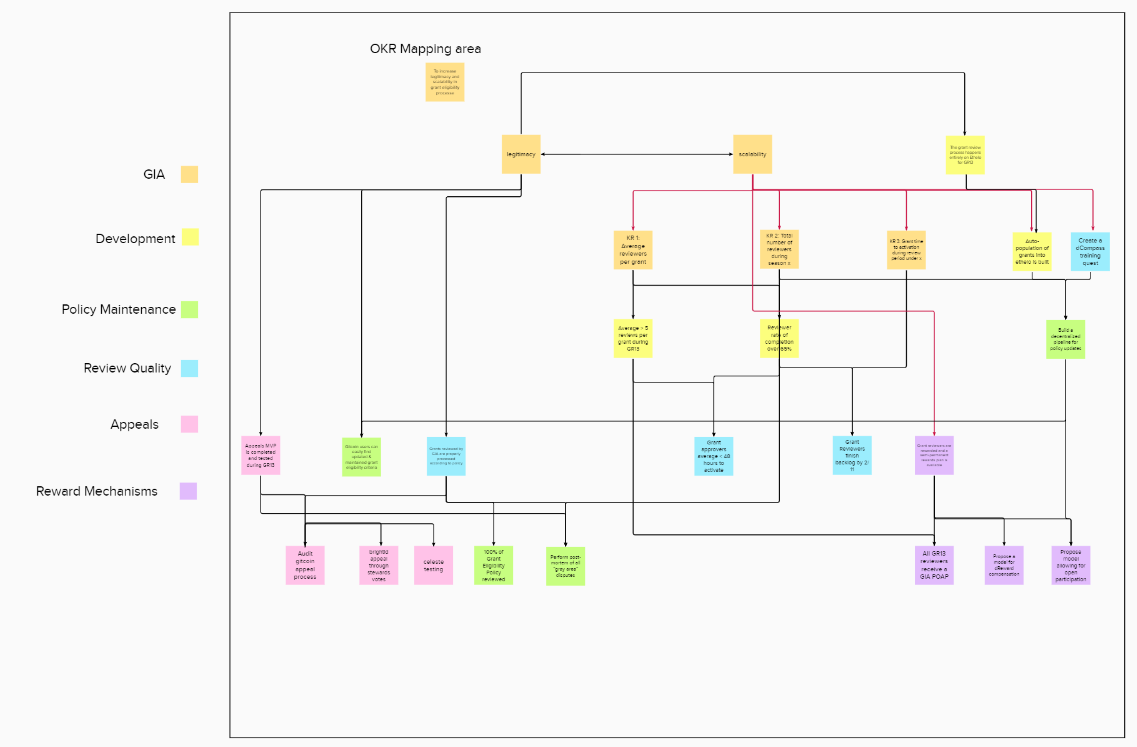
Creating such correlations between OKRs gives us an overall idea about the direction; a more granular approach can be created using multiple key indicators (KI) for every key result (KR).
The next step was to figure out an end-to-end process for reviewing to identify key points of escalations and identify the right metrics.
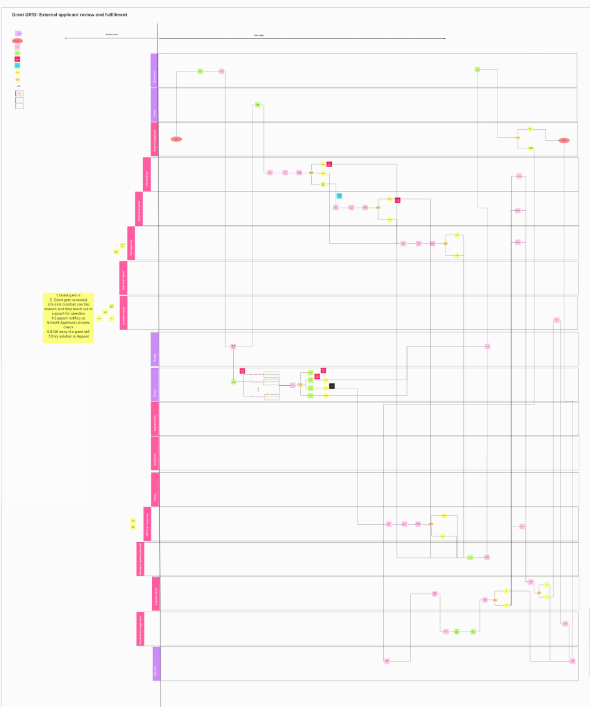
Within the graph flow, you may see there is a list of all different actors and their corresponding roles at the end-to-end review process, the key things we need to know before everything were the boundaries set for access to information for actors involved and the whole review process needed to be completed in less than 48 hours.
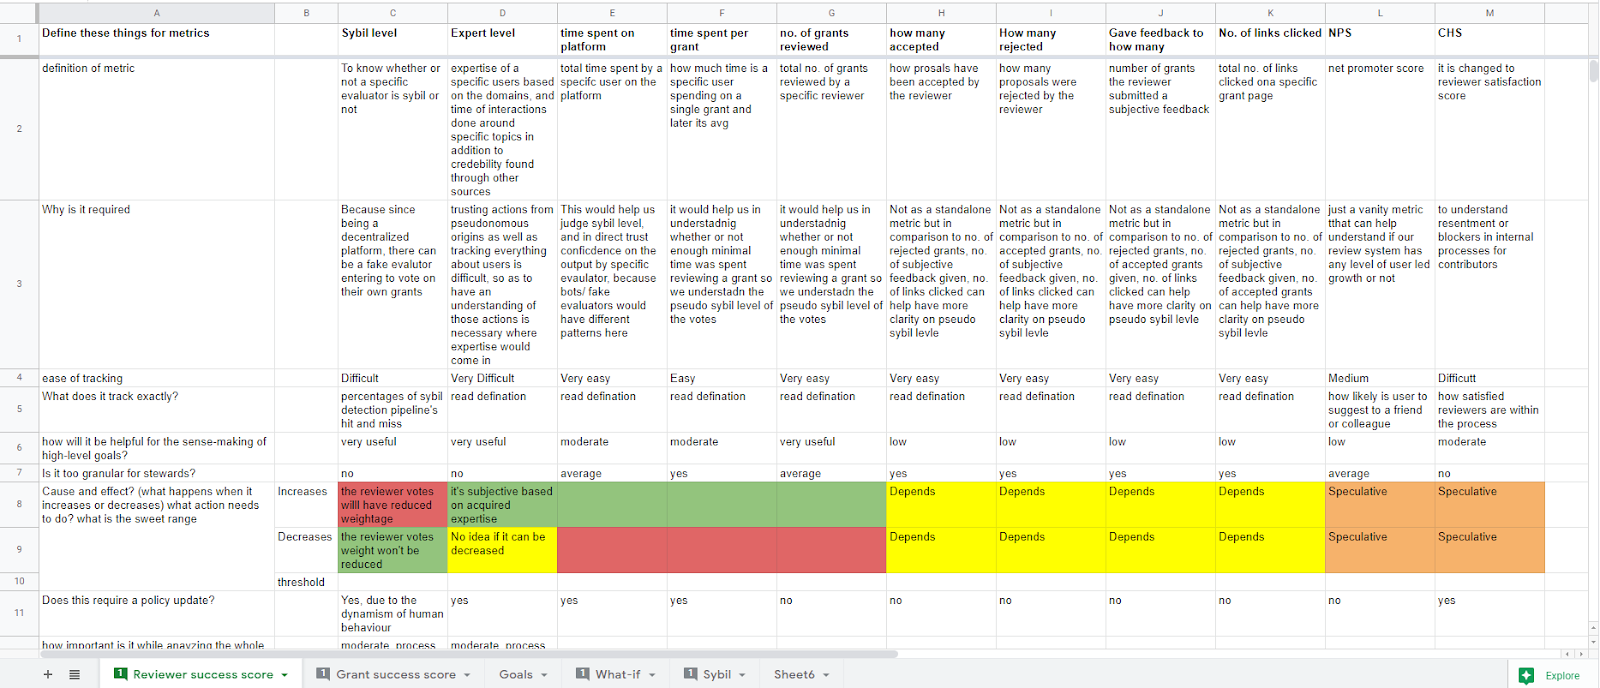
For every actor, we tried to collect answers to three questions:
- What happens if any of the actions performed are not done? How will it affect the overall pace of OKRs?
- What are the pain points of this actor? What is the part where the actor might most likely fail or will be unable to achieve?
- What is the happiest moment in this actor’s journey? When will be they happier performing the task here? What more can we do to make it happier?
Based on these questions we intended to go completely Newtonian to understand all possible metrics to make the grant round successful and at the same time try to improve the satisfaction of the contributors involved. After which we just needed to prioritize the right ones to be aligned with FDD’s top-level goals.
Metrics:
-
OKR squads completion rate/ roadmap velocity (3*5)
-
Reviewer success score:
-
Avg Sybil score ≤ “s”
-
Avg review time ≤ 15 (It’d be nice to have min_max, based on other factors that might need scrutiny)
-
No. of queries ≤ 1
-
Clarity of payments/ rewards (what is it in sync with? No. of grants reviewed, time spent on grants, etc)
-
Avg rejection rate per reviewer (f(knowledge factor))
-
Grants success score:
-
Platform metrics (Compliant degree)
-
(No. of grants per contributor) per epoch
-
No. of grants applying to appeals
-
percentage of (c) outcome
-
No. of funded: no. of rejected per epoch
-
No. of escalations requested
-
Avg. votes per grant
-
Avg. voters per grant
-
Grant round metrics
-
Cost per review
-
Total grant applications
-
Total applicants
-
Total new applicants
-
Total repeat winning applicants
-
Total reviewers
-
Total trusted seed reviewers
-
poison pill score
-
External growth metrics
Due to the complexity involved, metrics were bound to come up with assumptions. And also to be a combination of direct metrics and subjective sense-making. The tricky part after coming up with metrics was also to combine them for faster sense-making. So we came up with a general sense-making simulation for all the metrics proposed and how they are affected by the factors within FDD or even external to FDD.
SYBIL
Sybil’s working group consisted of 6 different squads within itself, and all of them worked towards the singular goal of creating grant rounds as well whole DAO Sybil free as much as possible using the power of both community and advanced technical approaches like machine learning. The major challenge was to define metrics by respecting balancing both privacy and transparency of the whole system without being aware of what the broadest end goal is.
Approach:
The first task was to understand to what extent the S13 OKRs have been achieved.
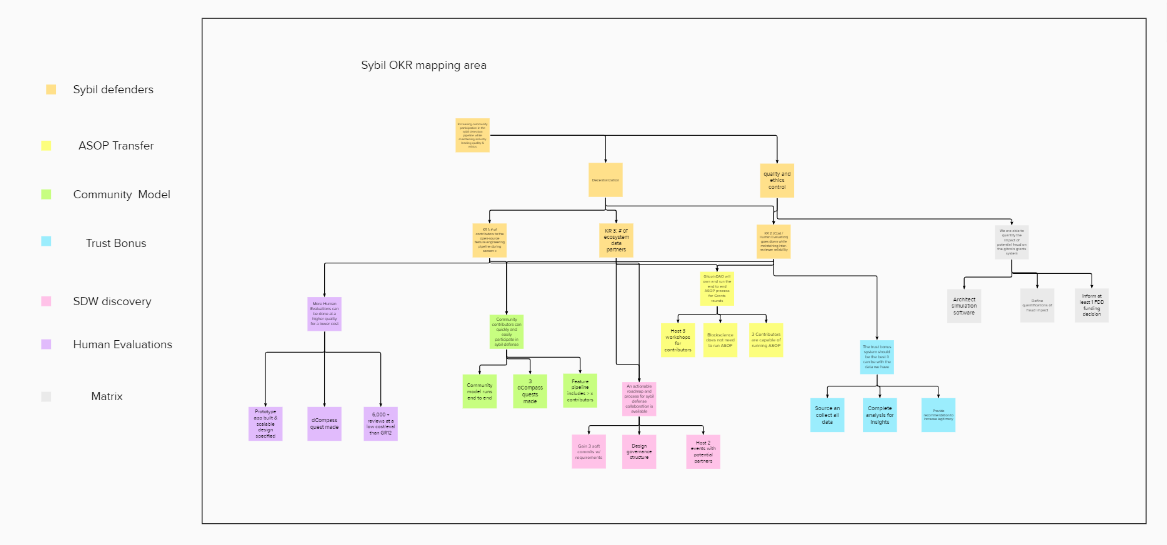
Since diving deep into the daily activities of these squads was undesirable, we went back to basics to participate in as much as open discussions as possible as well as ask a lot of questions to the related stakeholders. We at first tried to come up with defined questions for each squad.
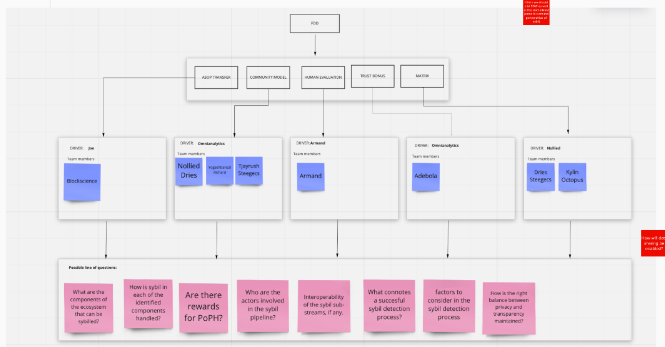
But this didn’t pan out as expected. We wanted to have base information that was interoperable across teams and precise So we did a couple of strategy sessions with squads asking them a combination of very vague (broader level) to very on-point questions.
For eg.
- After reviewing the previous grant round, how well is the detection algorithm working for the current round (How good are we today regarding its detection efficiency)?
- In the Sybil workstream, what is the current progress towards our future roadmap (total dependence on ML for Sybil detection)?
- The extra credit builds and discoveries
- In the future, how much are we enabling the community to participate? (Round over round, are a broader group of people involved in the overall process).
- Factors to be considered in the Sybil detection process.
- Which is the most important part happening in Sybil squads? (Consider if we only have that squad running and the rest all paused and we will be least affected?
- What parts do you feel are slow in Sybil’s work?
- Which parts can be improved or should be paced up in the coming Q?
- Does the trust bonus score have an impact on this? If so, it might be a good metric
- What is the dreamland version of anti-Sybil compliance for you in the long run?
These questions are not very intrusive in the day-to-day activities of the Sybil which would help us understand how we are performing and where we are going!
Based on analysis of such details collected through a lot of background research we managed to come up with the following first draft of metrics.
Metrics:
-
OKR squads completion rate/ roadmap velocity (3*6)
-
Sybil as a function of sense-making metrics
-
No. of evaluators
-
No. of Sybil grants vs applications
-
matrix results vs output
-
reviewers per round
-
No. of public datasets
-
QF adherence rate — can be called something as funding mechanism performance
-
Trust bonus score
-
Grantee’s compliance rate
-
HE success rate — vanity metric
-
code edit rate
-
Round over round metrics
-
flagging efficiency (bound by what?)
-
Fraud tax — cross-check definition
-
cost per evaluation
-
Sybil incidence
-
inter-reviewer reliability
-
external growth and communication metrics
-
Avg Sybil score
Sensemaking of the metrics:
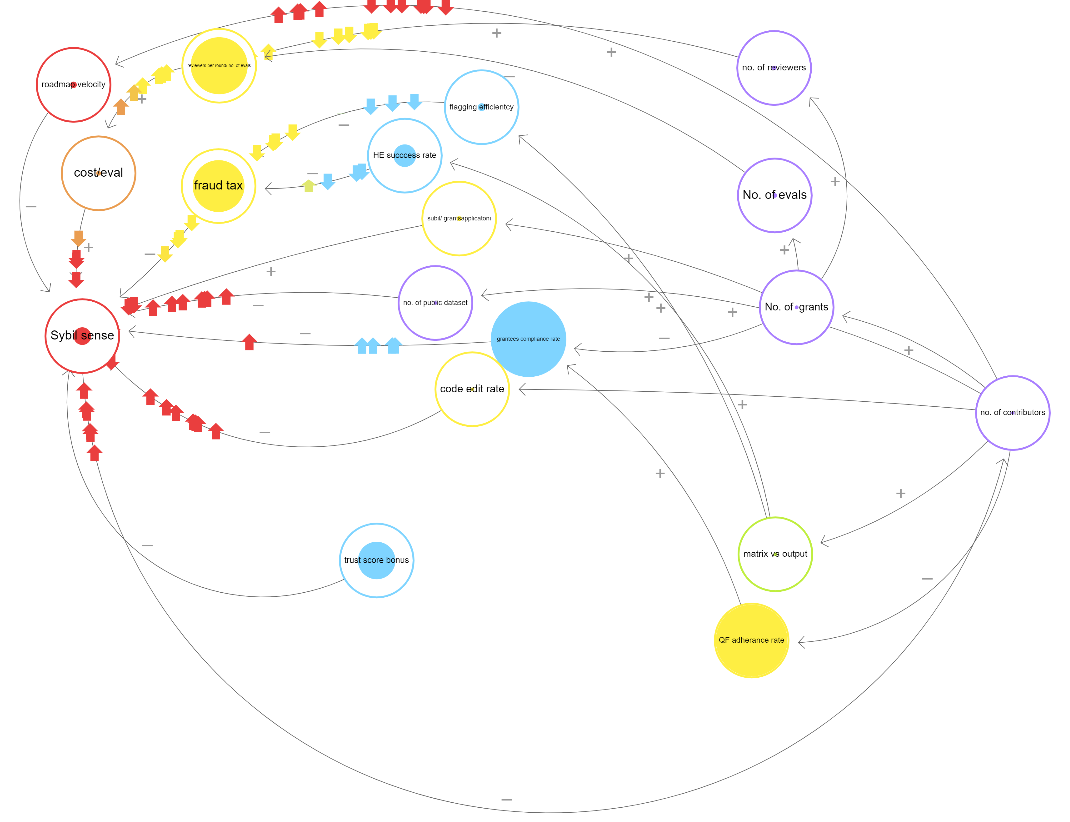
Dashboard: (Top level view)
- The issue with calculating a numerical value is that none of the above-mentioned parameters can completely be associated with each other in terms of cause and effect
- Few of them are complex themselves and have their sense-making
- So we will mention directly or indirectly proportional to understand the shade of the overall initiative (red, green, or yellow) following is the breakdown
- Health increases towards green signal (it’s going good) with an increase in these metrics (just a few examples)
- The scale of no. of times any grant is opened
- Scale of expertise
- Total no. of grants
- Total no. of grants reviewed
- Average no. of times any grant is reviewed
- Average review time per grant
- Reviewer satisfaction score (a very difficult to analyze metric so much that it might be completely subjective, dependant on pay satisfaction, queries, accountability and responsibility, amount of work, peer interaction, etc)
- No. of reviewers per round
- No. of public datasets
- Health increases towards red signal (it’s not going good) with an increase in these metrics (just a few examples)
- Sybil level
- Pseudo Sybil level (it is a combination of metrics like rejection-acceptance ratio and amount of time spent per grant or no. of times feedback given or no. of links clicked in specific grants) (it gives real-time feedback to understand the weightage of votes received from specific contributors) all bounded by average time spent on the platform
- Average no. of times appeals submitted
- Cost per evaluation
- The ratio of Sybil to total grants
- Fraud tax
- What does scale mean? :- It will be used for metrics for which a specific threshold cannot be set, so they will have different scales of colors within themselves.
- The red vs green plot of metrics will give a slope of the trend line that will eventually determine the performance of the round
PROJECT MANAGEMENT:
Project management is one of the most crucial things for the success of any initiative. The inherent “roadmap velocity” of squads can be better understood if there is a general understanding of their progress against their objectives.
We undertook background research to understand how to implement different scoring models to tasks. These important criteria emerged:
- The process should have the easiest mode of knowledge transfer since we through open communities where we find individuals from different walks of life. Here, we assume that if a specific model is too complicated to be explained to anyone in general then it needs to simplify further.
- It would be better if the scoring system is algorithmic so then, the knowledge transfer factor reduces tremendously.
- The scoring models shouldn’t act as a mode of extra incentive or as a driver to specific tasks only based on incentive.
- It shouldn’t be handled by a single expert only.
In general, project management is a means through which organizations maximize their value delivery through programs and projects, and for that to take place, those involved in the company decision making of approving work and prioritize projects (which could be the investors, board of directors, board of trustees, etc.) need to have a clear and similar understanding and view of the company’s project value to use a scoring model to select the most valuable work and assign the right resources to that work. Project value assessment is a core part of portfolio management with the scoring model being a tool to help assess the company’s project value.
A scoring model is a tool for evaluating project value. It is made up of various criteria to measure project value. The final score indicates the numeric value of the project and can be used to compare against other projects within the portfolio. The “weighted” aspect of this scoring process is a result of various criteria that would come up during the project planning phase as the company will consider specific criteria more important than others and will be expected to give those criteria a higher potential portion of the overall score.
“Scoring is simply a way to assign value to projects and keep the organization focused on the goals at hand. The better you can identify the projects that drive the business forward, the more value you can ultimately get from your investment. But scoring is not a set it and forget it system. It needs to be maintained and modified as organizational goals change or as priorities change.”
A weighted scoring model which can be referred to as a weighted scorecard is a project management method used for evaluating certain choices, such as prioritizing project actions, prioritizing the development of product features, purchasing new software, etc. A major advantage of this model is its ability to help in figuring out your priorities during the planning phase of the project life cycle and its efficient use of numerical scoring to rank the company’s strategic initiatives against benefit and cost categories. The Six Sigma prioritization matrix is one of the most well-known weighted scoring models in project management.
BUILDING THE SCORING MODEL
Building a good scoring model is integral to prioritizing work and prioritizing the criteria in the scoring model is a major component of the prioritization exercise. There are three steps involved in building a good scoring model.
Step 1 – Defining the Scoring Criteria
In building the scoring model the first task is to identify and define the criteria in the model. Usually, companies measure their project against financial metrics. Although this is a tangible and quantifiable method to measure the project value, experience shows that simply choosing and prioritizing work based on financial benefits has failed to produce optimum strategic results. In high-performing organizations, value can include intangible (qualitative) factors such as the degree of strategic accomplishment, customer impact, and organizational benefits. Minimally, a company’s scoring model should include three categories of criteria: strategic alignment, financial benefit, and risk. The three recommended scoring model criteria are defined below.
Strategic Criteria: measuring the company’s strategic alignment is important since portfolio management is focused on strategic execution. And this includes the company’s strategic objectives.
Financial Criteria: This criterion includes the net present value (NPV), return on investment (ROI), payback, earnings before interest and taxes (EBIT), etc.
Risk Criteria: Risk factors for every project should be considered in a good scoring model. While considering this criterion, it is worthy to know that if anyone has the opportunity to choose from two investments that have the same return, the least risky option would have a higher percentage of investors.
Step 2 – Prioritizing the Criteria
Once the scoring model has been defined, the next step is to prioritize the criteria from step 1. Pair-wise evaluation is a method of prioritizing criteria. Pair-wise Evaluation is a simple method of comparing two criteria against each other (also known as the Analytic Hierarchy Process, or AHP). This is easily accomplished in a one-on-one discussion session with each decision-maker. Often criteria might look good on paper but having a one-on-one discussion helps decision-makers to see things differently from how they’ve seen them and help them to consider whether the two strategic objectives are equally important or whether one is truly more important than another (when making comparisons using AHP, a criterion can be equal to, twice as important, three times as important, four times as important, etc. to the other criterion). And this method will not only determine the weighting of your scoring model, but it will also examine and ultimately align the governance team’s understanding of the organizational strategies.
According to the Project and Portfolio Management Landscape Report, prioritization was cited as the second biggest challenge for organizations, consistently behind resourcing, yet it is becoming increasingly recognized as a challenge. With this report, it is a call for action for companies to note this and get into action by overcoming the challenge of prioritization.
Step 3 – Review and Validate
The next step in building a scoring model is to review and validate the evaluations as a team. Things necessary to be done in this step are to
i.Highlight where the biggest gaps are between the members of the governance team and discuss why each person holds their view.
Ii.Know that no one’s evaluation is right or wrong as this discussion could give birth to new information that would help everyone align to a common understanding of each strategic objective, financial criteria, and risk criteria.
Advantages and Disadvantages
When considering a scoring model there are various perspectives attached to it that make up its advantages and disadvantages.
a. Time-Consuming: The processes involved are long and involve a series of meetings. Patience and substantial time allocation are required to make it effective.
b. Equality: Every member’s input is taken into consideration. There are no levels or caste differences. As there would be new points or ideas from a different point of view.
c. Optimization: All ideas are fully optimized and used effectively. During the one-on-one session, members can fully express themselves and see to it that they are well understood.
d. Conflict Reduction: Members all share the same point of view about the values of the project which reduces the conflict levels to some extent.
How Is It Helpful In Decentralized Systems?
Decentralized autonomous organizations (DAO) blend “decentralization”, “autonomy” and economic incentives using tokenized blockchain elements to maximize organizational effectiveness and value flow. A DAO helps to keep a network safe and optimized without the need for manual intermediation by its members.
A bottom-up approach is used to implement a DAO and it works by allowing managers to communicate aims, objectives, goals, and values through milestone planning, and team members are stimulated to develop individual to-do lists with the steps necessary to reach the milestones on their own.
For any DAO to implement the bottom-up research approach, there must be a little piece of information available to work on and not the full information. If there is a little piece of information then the system development can be built and then the following must be done;
· Decide what research is to be carried out and sketch out
· Check your piece of information available and check how it can be used to develop the system
· After taking the previous link it to the next phase and keep going
The criteria that make the scoring model appropriate for a decentralized system are:
Trustworthy: The decentralized autonomous organization would make you not need to trust any CEO Manager or Leader with your decision-making skills. The program or the organization will continue to function even when anyone decides to leave compared to when humans are the ones operating the system.
Can’t be shut down: In a decentralized autonomous organization, the only way to shut it down is if they had a very large amount of tokens and submitted a proposal to be voted on and went through the voting process fairly.
Open source: decentralized autonomous organizations are open-source which allows people to review them freely and are much more reliable as other programmers can help the main developers find bugs and propose ways to fix them.
| DAO | Scoring Model | |
|---|---|---|
| Governance | Democratic governance, no hierarchy | Democratic governance |
| Activity | transparent and public | General discussion and one-to-one discussion |
| Trust | Cryptography (provided by blockchain) | Everyone is trusted and has little or no ability to blame anyone for error as it was decided by all. |
| Voting/Decision Making | DAO participants are always required to cast their votes for any changes to be implemented | Everyone is involved and it is done both generally and one-on-one |
| Vote count/Decision Finalization | Votes are counted automatically, without intermediaries | Decisions are finalized when everyone agrees on a particular project value |
| Operational costs | Low | Low |
| Geographical dispersion | Anywhere | Anywhere |
How to start experimenting with it?
Determining criteria is an important step in creating a scoring model and tough to reach an agreement for many organizations while considering a project. This criterion helps organizations come to a final point of conclusion on what is most important for them, which types of projects should warrant investment, and how much they are willing to leave on the table to better deliver the projects they consider more valuable.
If the scoring model is being implemented for the first time, it does not have to be sophisticated from the start. Even a rudimentary high”, “medium”, and “low” is a good start to getting team members accustomed to using and abiding by the value score. Once the process is in place and ready for more, or if you find too many in the high section, you might need to add complexity to the system.
For several companies, the agreed-upon criteria are all important and serve essentially as checkboxes – a yes or no. If 4 or 5 boxes are checked for any given project, it is put in the “high” category. Those with 2-3 count as “medium,” and so on. However, that assumes that each of the criteria is equally important, which is not always (more accurately rarely) the case. To account for that, you can rank the criteria and multiply that by the point it receives.
Once you have a system to score projects, there will be a benchmark by which a project value won’t be considered for approval. This can be determined by resource capacity, time constraints, budget, or a combination of these and others. Knowing how to rank projects concerning other projects will help the company rank them according to their values.
Here are a few standard framework models that we think can be implemented at various points for DAOs:
Models:
- importance vs effort
- Importance vs unknown
- importance vs urgency
- SWOT
- PESTLE
- Cost of Failure
- Task comparison matrix
- Task utility comparison matrix
- Bradley-terry ratings
- Glicko scoring
A majority of these tasks are bound by required expertise or a combination of community signaling for task prioritization. This is a good thing in general for a DAO, but we may need to define and improve processes around it most certainly, to implement it successfully. And should try to factor in the extremely dynamic complexity of DAOs. With experimentation here our primary task is not to evaluate these methods themselves, as they have already been used before and proven their importance, the primary task is to understand when to use which method. For example, we cannot use the “pestle” method for smaller tasks like changing the color of a font. It might be important to know it somehow, but its cost of implementation will be more than the total possible maximum cost of failure of the cost.
SUMMARY and SNAPSHOT into FUTURE ROADMAP:
The mandate delivery group has explored multiple ways how we can create metrics for processes within DAOs, which are extremely dynamic. Although these are just first drafts of the possible metrics, they made sure that they were working in the right direction through numerous feedback loops from multiple SMEs. They also made sure that the metrics proposed are easy to implement in nature, so the cost of failure remains the lowest in the initial days as we learn more about the system. Our next step is to make a much more detailed sense-making by implementing detailed simulations, for which the frameworks are already in progress of how can we improve metrics themselves, or how we can come up with appropriate thresholds for a stable process flow for grants and Sybil.
Click here for an expanded view of the framework.
These frameworks and simulations will help us lay the ground for the next season by helping us create detailed dashboards. It will also help us in planning the right escalations for the most efficient flow of work and have a somewhat of a real-time understanding of the state of FDD, grants, and Sybil’s progress.
For example.
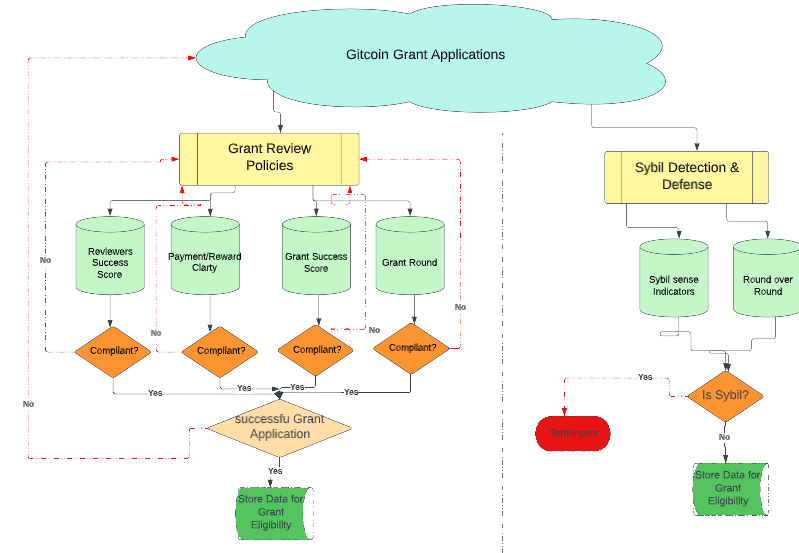
An Integrated Framework for GIA Grant Approval and Sybil Detection Process
From the GIA Stock and Flow diagram using cadCAD simulation, the mathematical expression is based on this proposition:
Grants are approved at a rate proportional to the Reviewer Success Score.
Reviewer Success Score is based on Grant Application Compliance, and it is a rate proportional to the Grant Review Policies. Therefore,
RSS is a reviewer source score and a prerequisite for grant approval in GitcoinDAO. As a policy in GitcoinDAO, for a grantee to have approval, such must score at least 70%. Hence, from the graph, initially, because the applicants were yet to master the policy and conditions of assessing grants in DAO, the RSS graph was on the high side above the grant assessed. At a point, there was break-even, showing the RSS to be equal to the grant assessed. This implies that the greater the understanding of the policy and conditions for grant approval in GitcoinDAO, the more grants can be assessed. So, after a while, the graph of grants becomes higher and more stable than the RSS. This reveals that the grant applicants in GitcoinDAO have improved in their understanding of policy and conditions to assess grants in GitcoinDAO. This reflects their better understanding of the Reviewer Source Score (RSS) which is a critical condition to assess grants in GitcoinDAO. Further, both the graph of RSS and grant became parallel to each other, this shows stability in the RSS, the conditions and policy are not frequently changed and give room for the applicants to master it over time. While the parallel graph of the grant shows that the number of grant applicants in GitcoinDAO is nothing changing but stable, new members are not applying over time.
- @Adebola @elbeth @kishoraditya (Fdd)