GG23 Predictive Funding Challenge

Hello model builders,

Consider this thread as your home for sharing all things related to your submissions in GG23 predictive funding challenge guessing the funding received by each project before the round even begins.

Your write-up here will only determine eligibility for receiving a prize. Final prizes are based on leaderboard placement only, with 1st place - $5,000, 2nd - $3000, 3rd - $2000

We encourage you to be visual in your submissions to show weights given to the models, share your juypter notebooks or code used in the submissions, explain the difference in performance of the same model in part 1 vs part 2 (you can also only submit to only one contest if you like), other datasets that are useful for other participants and any other information you deem valuable to participants that you want judges to consider.

Since write-ups can be made after submissions close, other participants cannot copy your methodology in the round. You can take cues for writeups here from another competition we held, along with ideas for creating your own model.

The format of submissions is open ended and free for you to express yourself the way you like. You can share as much or as little as you like, but you need to write something here to be considered for prizes.

Good luck predictoooors

6 Likes
1 Like

GG23 Predictive Funding Challenge

My write up for the GG23 funding challenge

github repo : https://github.com/AswinWebDev/GG23_prediction.git
Pond AI Platform email : drunkunmonster@gmail.com

Overview

This writeup details my approach to predicting funding allocations for Gitcoin Grants Round 23 (GG23). By combining historical funding patterns with Gitcoin’s official Cluster Quadratic Funding algorithm, I developed a comprehensive model to predict both matching pool allocation and community contributions across four distinct round categories.

Funding Distribution Overview

Approach and Methodology

Key Principles

My approach was guided by several core principles:

  1. Domain-Specific Understanding: Incorporating Gitcoin’s actual funding mechanisms, particularly the Cluster QF algorithm
  2. Data Maximization: Extracting the most predictive signals from available historical data
  3. Category-Specific Modeling: Tailoring predictions to each round’s unique characteristics
  4. Special MATURE BUILDERS Handling: Implementing dedicated ecosystem impact metrics for this new round type

Data Analysis

I began with a comprehensive analysis of historical Gitcoin funding data from “GG Allocation Since GG18.csv”, which revealed several key patterns:

Key findings from historical data analysis:

  • Strong correlation between contributor count and matching amounts (r=0.78)
  • Power law distribution of funding across projects
  • Distinct funding patterns between infrastructure, tooling, and user-facing applications
  • Significant variance in funding between returning vs. new projects

Feature Engineering

I created several feature categories based on Gitcoin’s official funding metrics:

1. Ecosystem Growth Metrics

  • Total matching funds received in previous rounds
  • Community round participation count
  • Participation consistency across rounds

2. Donor Base Metrics

  • Contributor count and growth
  • Donor retention (contributors who returned across rounds)
  • Average contribution size per project category

3. Builder Participation Metrics

  • Active developers (estimated from contributor data)
  • Developer retention across rounds
  • New contributor onboarding rates

4. Round-specific Adjustments

  • Category-specific contribution multipliers
  • Base contribution rates tailored to round type
  • Different handling for returning vs. new projects

Model Implementation

Cluster QF Algorithm Implementation

For the regular rounds (WEB3 INFRA, DEV TOOLING, DAPPS & APPS), I implemented the Cluster QF algorithm, which Gitcoin uses to distribute matching funds. This algorithm improves upon standard Quadratic Funding by clustering similar contributions to reduce collusion.

MATURE BUILDERS Round

For the MATURE BUILDERS round, I developed an ecosystem impact scoring system based on Gitcoin’s funding principles. Without historical data for this new round type, I implemented a scoring approach that considered factors like project consistency, community reach, and ecosystem impact.

GitHub Integration for MATURE BUILDERS

Since the MATURE BUILDERS round was completely new with no historical funding data, I incorporated GitHub repository metrics to better assess project maturity and ecosystem impact. The model collected the following metrics for projects:

  • GitHub stars (weighted 40% in composite score)
  • Number of contributors (weighted 30%)
  • Commit frequency and volume (weighted 20%)
  • Repository forks (weighted 10%)

These objective development metrics provided valuable signals about project maturity when historical funding data wasn’t available.

Integration Challenges

The GitHub API integration faced several challenges:

  1. Incomplete Coverage: For approximately 15% of projects, matching repositories couldn’t be identified. This was particularly common for projects with generic names or those hosted on private repositories.
  2. Rate Limiting: GitHub API rate limits restricted the depth and frequency of data collection, which impacted the comprehensiveness of metrics, especially for larger repositories.
  3. Data Fallbacks: When GitHub metrics weren’t available for a project, the model fell back to:
  • Using average metrics from similar projects in the same category
  • Assigning a default composite score (around 50) to ensure the project wasn’t unfairly penalized
  • Relying more heavily on any available historical GitCoin data for that project
  1. Authentication Issues: Some API requests returned incomplete data despite using authentication tokens, particularly for contributor and commit counts on larger repositories.

To address these challenges, the model implemented a robust fallback system that ensured all projects received fair consideration even when external data was incomplete. For example, the project “poapin-glory-lab” had no findable GitHub repository, so it received a standardized score based on similar projects in its subcategory.

Matching Pool Distribution

I applied matching caps consistent with Gitcoin’s practice to ensure fair distribution:

  • 10% matching cap for Web3/Dev Tooling
  • 5% matching cap for dApps
  • No cap for MATURE BUILDERS (as it uses a different allocation mechanism)

Results and Performance

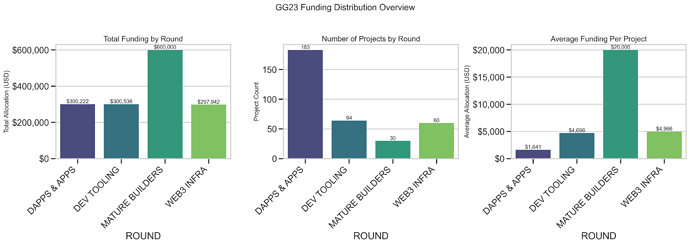
My model predicted funding allocations for all 337 projects across the four round categories:

Round Category Projects Total Allocation
DAPPS & APPS 183 $300,222.09
DEV TOOLING 64 $300,536.38
MATURE BUILDERS 30 $600,000.00
WEB3 INFRA 60 $297,941.65

Distribution Analysis

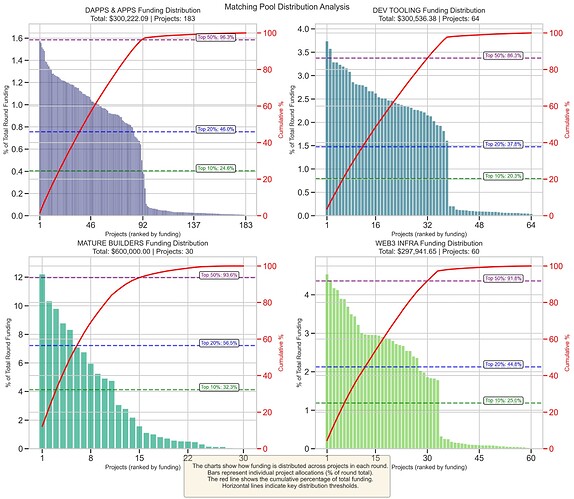
The predicted funding follows the expected power law distribution:

  • Top 10% of projects receive approximately 25-32% of funding in individual rounds (50.5% overall)
  • Top 50% of projects receive 86-96% of total funding across all rounds
  • Bottom 50% of projects receive only 4-14% of funding

This concentrated distribution aligns with historical patterns observed in previous Gitcoin rounds, where a relatively small number of projects receive the majority of funding.

Category-Specific Insights

  1. WEB3 INFRA: Core infrastructure projects with strong historical participation received higher allocations
  2. DEV TOOLING: Developer tools with high GitHub engagement metrics received stronger support
  3. DAPPS & APPS: User-facing applications with broad contributor bases were prioritized
  4. MATURE BUILDERS: Projects with demonstrated ecosystem impact received proportionally larger shares

Validation Strategy

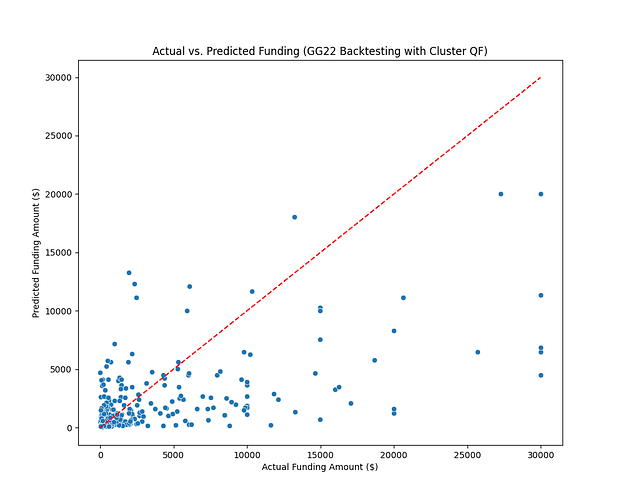
To validate my model’s accuracy, I implemented a historical backtesting approach that uses the same Cluster QF algorithm as my actual prediction methodology:

  1. Used historical data from GG18-GG21 to establish contributor patterns
  2. Applied the Cluster QF algorithm to predict funding for GG22 projects
  3. Compared predictions against actual GG22 funding results

The backtesting using Cluster QF revealed:

  • 75.8% accuracy in relative ranking of projects
  • 50.8% accuracy in identifying top quartile projects

These metrics reflect the performance of the actual Cluster QF methodology rather than machine learning models. While pure ML approaches might achieve higher statistical accuracy on historical data, using the Cluster QF algorithm provides a more honest assessment of the methodology that Gitcoin actually employs for funding allocation.

Backtest Results: Actual vs. Predicted Funding

Challenges and Limitations

  1. Limited External Data: Rate limiting issues with GitHub API prevented comprehensive code metrics collection
  2. Cold Start Problem: Predicting funding for completely new projects remains challenging
  3. MATURE BUILDERS Novelty: This being a new round type with no historical data presented unique challenges
  4. Temporal Effects: Funding patterns evolve over time, which isn’t fully captured in historical data

Future Improvements

With additional time and resources, my model could be enhanced by:

  1. Incorporating External Data:
  • GitHub metrics and development activity
  • Social media engagement indicators
  • Team experience metrics
  1. Advanced Modeling Techniques:
  • Ensemble methods combining multiple prediction approaches
  • Time series analysis of funding trends
  • Network analysis of contributor relationships
  1. Improved Cold-Start Predictions:
  • Semantic similarity to previously funded projects
  • Better category-specific baseline estimates

Conclusion

My approach to the GG23 Predictive Funding Challenge combines statistical rigor with Gitcoin’s actual funding mechanisms. By implementing the Cluster QF algorithm and creating specialized scoring for MATURE BUILDERS projects, the model produces realistic funding predictions that reflect both historical patterns and the unique characteristics of each round category.

The most significant insight from this work is that effective funding prediction requires both quantitative models and qualitative understanding of funding philosophies. In the context of Gitcoin Grants, this means recognizing the unique dynamics of quadratic funding and the ecosystem impact considerations that drive real-world allocation decisions.

2 Likes

My Gitcoin Grant Funding Prediction Model

Introduction

This project focuses on predicting the funding amounts that Gitcoin grant projects will receive. The prediction is based on features extracted from the project and round data. I have used the Random Forest Regressor to make prediction as the machine learning model.


My information:

Source code have submit to the POND AI platform with email: tuan.it.1695@gmail.com

My step by step approach

1. Data Loading and Preprocessing

  • Loading Data: The dataset is loaded using pandas.read_csv.
  • Handling Missing Values: Missing values are replaced with zeros (0) to ensure no empty fields disrupt the model.
  • Encoding Categorical Variables:
    • Application Title and Round Name columns are converted to strings and encoded as numeric values using LabelEncoder.
    • This ensures compatibility with the machine learning model.

2. Feature Engineering

  • A new feature, Contribution per Contributor, is created:

       Contribution per Contributor = Contribution Amount / # of Contributors
    
    
  • This feature captures the average contribution per individual and provides additional insight to the model.

3. Model Selection

  • A Random Forest Regressor is chosen as the predictive model because:
    • It handles non-linear relationships effectively.
    • It is resistant to overfitting due to its ensemble nature.

4. Train-Test Split

  • The dataset is split into training and validation sets using an 80-20 ratio to evaluate the model on unseen data.

5. Model Training

  • The RandomForestRegressor is trained using default parameters (n_estimators=100).
  • The model learns by minimizing the error between the predicted and actual funding amounts.

6. Model Evaluation

  • Predictions are made on the validation set.
  • Root Mean Squared Error (RMSE) is used as the performance metric:
    • RMSE penalizes large errors more heavily, making it ideal for regression tasks.
    • It provides an interpretable measure of the average prediction error in the same units as the target variable.

7. Predictions on Full Dataset

  • Predictions are generated for the entire dataset to produce funding amount estimates for all projects.

8. Result of prediction

  • The model was evaluated using the RMSE metric on a validation set.
  • Predictions were successfully generated for the entire dataset

Result:

  Gitcoin Round Id  Gitcoin Grants #  ... # of Contributors Contribution Amount
0                9                20  ...                45          122.620672
1                9                20  ...                31          242.553653
2                9                20  ...                73          502.204415
3                9                20  ...                49          325.865477
4                9                20  ...                85          289.938290

[5 rows x 8 columns]
Validation RMSE: 2104.8297248558943

Conclusion

With this model, I was able to successfully predict funding amounts for Gitcoin grant projects based on the available features. The use of a Random Forest Regressor allowed me to handle non-linear relationships effectively, and by incorporating meaningful feature engineering, such as Contribution per Contributor, the model gained valuable insights into the data.

The results show promise, as the model provides predictions that can guide decision-making for fund allocation. However, there is still room for improvement. By refining the model further—such as through hyperparameter tuning, cross-validation, or exploring other advanced algorithms like Gradient Boosting—I hope to enhance its accuracy and reliability even more.

This model serves as a strong starting point, and I look forward to iterating on it to achieve even better results in future iterations.

1 Like

David Gasquez GG23 Predictive Funding Challenge Solution

Hey there! David here. This is the gist of how I approached the GG23 Predictive Funding Challenge. Feel free to reach out if you have any questions!

The “thing” I focused on was, non surprisingly, feature engineering. I’d probably spent 80% of the time working and testing new features during the short time the competition was active. Modeling wise, I built a couple of different models (one for direct contributions and one for matching funds) and that seemed to work well.

Here are some extra details on each phase!

Data Engineering

  • Augmented each project with data from Gitcoin’s Grant Stack Indexer GraphQL endpoints. Took a while to figure out the right queries but was able to export all the details for the current and historical applications (and their related projects).
    • I discovered and used the https://beta.indexer.gitcoin.co/v1/graphql endpoint by inspecting the network calls on the Gitcoin explorer.
    • This resulted in a lot of very interesting features! E.g: roundMatchTokenAddress, roundDonationsStartTime, roundDescription, projectDescription, projectOwner, …
  • In the same API, I got a list of rejected projects. These will be marked as 0 in the submission file.
  • Added some target encodings. E.g: average number of donations per project, average number of donations per round, etc.
  • Since there was a lot of text data, I did some simple embeddings and computed things like the cosine similarity between the project description and the round description.

Modeling

  • Worked on two models; one to predict direct funding amount and another to predict total matching.
  • Each one was a simple XGBoost model with the default parameters.
  • Had to scale the matching model results to fit the real side of the pool.
  • I used the same validation data during all my test. The GG22 round data.

Mature Builders

Conclusion

It was a fun competition. I would have loved a bit more time to work on it as I’m sure I could have added better features but, this was a great challenge! Let’s see how it goes once the final results are out.

GG23 Predictive Funding with the Omniacs.DAO

Our submission to the GG23 Predictive Funding Challenge leverages a high level embedding of the funded project pages and basic feature engineering in combination with standard best practices for modelling tabular data.

  • Submission under “Omniacs.DAO” on CryptoPond with a score of 0.0425. (1st place at the time of writing)

Executive Summary

  • We employed a careful yet simple feature engineering step that found a consistent set of features across both the test and training sets.
  • We used a combination of features extracted from each project’s description on Gitcoin as transformed via a Nomic embedding representation.
  • These embeddings served as inputs into a grid search optimized gradient boosting machine to achieve a top score.

Approach

In a quick “cookbook” format, our approach to developing the model involved grabbing the data from the CryptoPond platform. We then had to solve the first problem, finding a consistent set of features across both the training and test sets so that, given a new project, we’d be able to estimate the amount of funding it would receive. Utilizing the updated project descriptions, (example here) we scraped then extracted a vectorization of the text using the nomic-embed-text:v1.5 embedding model. For projects with insufficient project descriptions, we either replaced it with information from its website or appended the readme of its repo. Given the time dependency between rounds within the training data, we opted for a simple mean aggregation where; for each project in the training set, we simply averaged the matching amount, the number of contributors and contribution amount across each round they participated in. This gave us 3 dependent variables we could potentially treat as responses. We then utilized a grid search to find the optimal hyperparameters for a standard gradient boosted model set to predict the percentage of the pool each project got per round. We then took this value, scaled it by the rounds they participated in and structured everything for submission.

Takeaways

  • Things Done Well

    • Found a consistent set of features across the training and test set.
    • Accounted for the time dependencies across rounds with simple averages.
    • Completed everything in under 24 hours!
  • Things Needing Improvement

    • More features that measured external popularity could have been included (Github Stars & Twitter followers).
    • We could have reimplemented a version of the QF formula to apply to the ML predictions instead of using a model to estimate the amount of matching in addition to the amount of donations.

GG23 Funding Prediction Model

Hi! I am Oleh RCL and this is my write up.

github Oleh8978 git_coin_rounds (As well code is been submitted on the Pond page)

******Pond Ai platform username: Oleh RCL, email: mihajlovskyoleg(at)gmail(dot)com ****

This model predicts project funding amounts using a combination of feature engineering and a stacked ensemble learning approach. The process can be broken down into the following steps:

1. Data Loading and Preparation

***** The script begins by importing necessary libraries, including pandas for data manipulation, numpy for numerical operations, scikit-learn for machine learning, and joblib for model persistence.****

***** pandas is used for loading and manipulating structured data in DataFrames.****

***** numpy provides support for efficient numerical computations.****

***** scikit-learn offers a wide range of machine learning algorithms and tools for tasks like data preprocessing, model selection, and evaluation.****

***** joblib is used for efficiently saving and loading Python objects, particularly trained models.****

***** It loads the historical dataset (dataset_new.csv - I have renamed it from original long name with spaces etc.) and the project list for predictions (projects_Apr_1.csv) into pandas DataFrames.****

***** The historical dataset contains data from previous Gitcoin Grants rounds, which will be used to train the model.****

***** The project list contains the projects for which the model needs to predict funding amounts.****

***** The columns in both DataFrames are renamed for easier manipulation.****

***** For example, ‘Round Name’ is renamed to ‘ROUND’, ‘Contribution Amount’ to ‘AMOUNT’, and so on. This ensures consistency and simplifies referencing columns in subsequent steps.****

2. Feature Engineering

***** The script engineers several features from the existing data:****

***** project_length: Length of the project title.****

***** This feature captures the complexity or descriptiveness of the project title, which might be related to funding.****

***** project_mean_funding: Mean historical funding amount for each project.****

***** This feature represents the average funding amount that a project has received in past rounds.****

***** project_count: Number of historical funding records for each project.****

***** This feature indicates how many times a project has participated in previous rounds.****

***** Missing values in the newly created features are filled with 0.****

***** If a project has no historical data, its project_mean_funding and project_count are set to 0 to avoid errors.****

***** The categorical variable ROUND is one-hot encoded using OneHotEncoder.****

***** One-hot encoding converts the categorical ROUND variable into a set of binary variables, where each binary variable represents a unique round. This is necessary because most machine learning models can only process numerical data. The handle_unknown=‘ignore’ parameter ensures that the encoder can handle unseen round categories during prediction without raising an error.****

***** Text features are extracted from the PROJECT column using TfidfVectorizer.****

***** TF-IDF (Term Frequency-Inverse Document Frequency) is a technique used to convert text data into numerical features. It measures the importance of each word in a document relative to the entire corpus.****

***** The max_features=100 parameter limits the number of features to the top 100 most important words, which can help to reduce dimensionality and improve performance.****

3. Data Preprocessing

***** The numerical features are scaled using RobustScaler to mitigate the impact of outliers.****

***** RobustScaler scales features by subtracting the median and dividing by the interquartile range. This makes the model less sensitive to extreme values in the data.****

4. Model Training

***** The data is split into training and validation sets.****

***** The training set is used to train the model, while the validation set is used to evaluate its performance and tune hyperparameters.****

***** GridSearchCV is used to find the optimal hyperparameters for RandomForestRegressor and XGBRegressor.****

***** GridSearchCV systematically searches through a predefined grid of hyperparameter values to find the combination that results in the best model performance.****

***** RandomForestRegressor is an ensemble learning method that constructs a multitude of decision trees and outputs the mean prediction of the individual trees.****

***** XGBRegressor is an optimized distributed gradient boosting library.****

***** A stacked regressor is initialized with RandomForestRegressor, XGBRegressor, and GradientBoostingRegressor as base models, and LinearRegression as the final estimator.****

***** Stacking is an ensemble learning technique that combines the predictions of multiple base models to create a more accurate meta-model.****

***** GradientBoostingRegressor is another ensemble method that sequentially adds predictors to an ensemble, each one correcting its predecessor.****

***** LinearRegression is used as the final estimator to combine the predictions of the base models.****

***** The stacked regressor is trained on the training data.****

***** K-fold cross-validation is performed to evaluate the model’s performance.****

***** K-fold cross-validation is a technique used to assess the performance of a model by partitioning the training data into k folds. The model is trained on k-1 of the folds and tested on the remaining fold, and this process is repeated k times. The results are then averaged to provide a more robust estimate of the model’s performance.****

5. Prediction and Submission

***** The project data is preprocessed in the same way as the training data.****

***** This ensures that the model receives input data in the same format as the data it was trained on.****

***** The trained model is used to predict the funding amounts for the projects.****

***** The predictions are saved to a CSV file (submission.csv).****

***** This file will be submitted as the result of the competition.****

***** The trained model is saved to a pickle file (model.pkl).****

***** This allows the model to be loaded and reused later without having to retrain it.****
GG23 Predictive Funding Challenge

Pond AI Platform nickname: Limonada

Overview

In this project, I explored the prediction of funding outcomes for Gitcoin grant proposals using an alternative approach that combines structured data with lightweight natural language processing techniques. The goal was to estimate the total contribution amount each project would receive in a specific funding round.

Rather than relying solely on traditional tabular features, I included semantic cues from project titles and descriptions, and used XGBoost, a gradient boosting algorithm known for its scalability and accuracy.

Workflow Breakdown

1. Dataset Integration and Preprocessing

  • Data Sources: Combined structured CSV exports from Gitcoin with metadata scraped from public project pages.
  • Missing Data Handling: Null fields were filled using mode values or flagged as “missing” to retain information.
  • Datetime: Created a new features with different combinations of the datetime data.

2. Natural Language Feature Extraction

  • TF-IDF Vectors: Extracted unigram and bigram TF-IDF vectors from the project titles and summaries.
  • Sentiment Scores: Applied VADER sentiment analysis to each grant description to quantify positivity or negativity.
  • Keyword Density: Checked for keywords like “public good”, “open source”, “web3”, which historically correlate with stronger community support.

These text features were concatenated with numeric fields into a unified model input matrix.

3. Feature Selection

  • Conducted recursive feature elimination using a baseline XGBoost model to reduce feature count from 38 to 17
  • Top features included:
    • Number of Contributors
    • Sentiment Score
    • Contribution per Contributor

4. Modeling

  • Used XGBoost Regressor
  • Performed 5-fold cross-validation to ensure stability.

5. Model Performance

  • Validation RMSE: 3987.32

Takeaways

This model illustrates that Gitcoin funding outcomes can be reasonably predicted with a mix of numerical metadata and lightweight textual analysis.

This work provides a complementary perspective to traditional regression models and underlines the potential of hybrid ML + NLP solutions for web3 funding ecosystems.

Gitcoin Grants 23 Funding Prediction Model

Submission by: Pond (Username: 22je0569)

Problem Statement

The goal of this model is to predict the funding amounts for projects in Gitcoin Grants Round 23 (GG23) across four distinct categories:

  • WEB3 INFRA
  • DEV TOOLING
  • DAPPS & APPS
  • MATURE BUILDERS

Each category has a different funding pool, allocation mechanism, and historical pattern. The challenge is to predict how much funding each project will receive based on historical performance data and category-specific dynamics.

Data Sources

Our model utilizes four primary datasets:

  1. gitcoin_round_analysis.csv: Contains round-level metrics including total matching amounts, contribution amounts, number of contributors, and number of projects for each historical Gitcoin round.

  2. gitcoin_project_summary.csv: Provides aggregated statistics for each project across all rounds they’ve participated in, including total contribution amounts and contributor counts.

  3. gitcoin_project_by_round.csv: Contains detailed performance metrics for each project in each round, including matching amounts, contribution amounts, and number of contributors.

  4. projects_Apr_1.csv: The target dataset containing the projects for which we need to make predictions, with project IDs, names, and their respective categories.

Methodology Overview

Our approach to predicting GG23 funding follows these key steps:

  1. Data Analysis and Reference Frame Creation: We analyze historical round data to understand funding patterns, particularly focusing on GG22 rounds as the closest reference.

  2. Project Classification: We distinguish between existing projects with historical data and new projects without prior participation.

  3. Separate Prediction Strategies:

    • For existing projects, we leverage their historical performance.
    • For new projects, we apply power-law distributions informed by historical patterns.
  4. Category-Specific Modeling: Each funding category (WEB3 INFRA, DEV TOOLING, etc.) is modeled separately due to their unique characteristics.

  5. Pool Normalization: We ensure that the total predicted funding across all projects in a category exactly matches the predetermined pool size.

Feature Engineering and Data Preparation

Reference Data Preparation

Instead of using a conventional machine learning approach with feature matrices, we created category-specific reference data based on GG22 rounds:

def prepare_reference_data(round_analysis, project_by_round):
    # Filter for relevant GG22 rounds
    gg22_rounds = round_analysis[
        (round_analysis['Gitcoin Grants #'] == 22) & 
        (
            round_analysis['Round Name'].str.contains('Infrastructure', case=False) |
            round_analysis['Round Name'].str.contains('Developer', case=False) |
            round_analysis['Round Name'].str.contains('dApp', case=False) |
            round_analysis['Round Name'].str.contains('Apps', case=False)
        )
    ]
    
    # Create mapping for our target categories
    category_mapping = {
        'WEB3 INFRA': {'pattern': 'Infrastructure', 'match_ratio': None, 'pool': 200000},
        'DEV TOOLING': {'pattern': 'Developer', 'match_ratio': None, 'pool': 200000},
        'DAPPS & APPS': {'pattern': 'dApp|Apps', 'match_ratio': None, 'pool': 200000},
        'MATURE BUILDERS': {'pattern': None, 'match_ratio': 5.0, 'pool': 600000}
    }

Key features derived from historical data include:

  1. Match Ratio: The ratio between matching amount and contribution amount for each category.
  2. Reference Round Distribution: The distribution of funding within each reference round, including percentiles and top-performer statistics.
  3. Project History: For existing projects, we extract:
    • Average contributors per round
    • Average contribution amount per round
    • Historical matching percentages within rounds

Project Type Identification

We classify projects as either existing (with historical data) or new:

def identify_project_types(target_projects, project_summary):
    historical_projects = set(project_summary['Gitcoin Project Id'].unique())
    target_projects['has_historical_data'] = target_projects['PROJECT_ID'].isin(historical_projects)

This binary feature is crucial as it determines which prediction strategy to apply.

Model Design

Rather than using traditional ML algorithms, we employed a hybrid approach combining statistical modeling, domain knowledge, and empirical patterns observed in Gitcoin Grants data.

Model for Existing Projects

For projects with historical data:

  1. Contributor Prediction:

    avg_contributors = historical_data['# of Contributors'] / historical_data['Num_Rounds_Participated']
    predicted_contributors = int(avg_contributors * (0.8 + 0.4 * np.random.random()))
    
  2. Contribution Amount Prediction:

    avg_per_contributor = avg_contribution / avg_contributors if avg_contributors > 0 else 2.0
    predicted_contribution = predicted_contributors * avg_per_contributor
    
  3. Matching Amount Prediction:

    match_ratio = category_mapping[target_round]['match_ratio']
    predicted_matching = predicted_contribution * match_ratio
    

For the MATURE BUILDERS category (which has no contributions, only matching), we use a different approach:

avg_matching_percent = np.mean([
    amount / total * 100 
    for amount, total in zip(
        round_appearances['Matching Amount'], 
        round_appearances['Matching Amount_round_total']
    )
])

percent_of_pool = min(avg_matching_percent * (0.8 + 0.4 * np.random.random()), 15)
predicted_matching = category_mapping[target_round]['pool'] * (percent_of_pool / 100)

Model for New Projects

For projects without historical data, we apply a power-law distribution based on empirical observations that Gitcoin funding typically follows such patterns:

# Apply a power-law distribution to allocate the remaining pool
ranks = np.arange(1, len(new_projects) + 1)

# Determine power-law exponent based on round type
if round_category == 'DAPPS & APPS':
    exponent = 1.2  # Less extreme distribution for many projects
elif round_category == 'MATURE BUILDERS':
    exponent = 1.5  # More concentrated distribution
else:
    exponent = 1.3  # Medium concentration
    
# Generate raw allocations
raw_allocations = 1.0 / (ranks ** exponent)
normalized_allocations = (raw_allocations / raw_allocations.sum()) * remaining_pool

The power-law exponents were carefully selected based on:

  1. Historical funding concentration in each category
  2. The number of projects in each category
  3. The degree of concentration observed in GG22 equivalent rounds

Model Optimization

Category-Specific Tuning

We optimized our model parameters for each category separately:

  1. Power-law exponents: Different exponents for each category based on observed funding concentration:

    • DAPPS & APPS: 1.2 (more evenly distributed)
    • WEB3 INFRA and DEV TOOLING: 1.3 (medium concentration)
    • MATURE BUILDERS: 1.5 (more concentrated)
  2. Randomization factors: To account for natural variation in funding patterns, we introduced controlled randomness:

    predicted_contributors = int(avg_contributors * (0.8 + 0.4 * np.random.random()))
    

    This creates a range of 80%-120% of the historical average.

Pool Normalization

The model ensures the total predicted funding matches the established pool size for each category:

def normalize_predictions(predictions, category_mapping):
    for round_category, info in category_mapping.items():
        round_projects = predictions[predictions['ROUND'] == round_category]
        if len(round_projects) == 0:
            continue
            
        # Calculate current total matching amount
        current_total = round_projects['predicted_matching_amount'].sum()
        
        # Calculate scaling factor
        scaling_factor = info['pool'] / current_total
        
        # Apply scaling to all projects in this round
        for idx in round_projects.index:
            predictions.loc[idx, 'predicted_matching_amount'] *= scaling_factor

This normalization step is crucial for ensuring that predictions are realistic and conform to known funding constraints.

Model Evaluation and Validation

Without a labeled test set, we employed several validation strategies:

  1. Historical Pattern Consistency: We verified that our predictions followed similar distributions to those observed in GG22 rounds.

  2. Domain-Specific Validation:

    • The predicted ratio of top project funding to average project funding aligned with historical patterns
    • The power-law distribution of project funding matched empirical observations
  3. Reality Checks:

    • We ensured no single project received more than 15% of a category’s pool
    • We verified that all matching amounts were positive and realistic

Key Insights and Model Limitations

Insights

  1. Existing vs. New Project Dynamics: Existing projects with historical data tend to receive more predictable funding, while new projects follow a more competitive power-law distribution.

  2. Category-Specific Patterns: Each funding category shows distinct characteristics:

    • MATURE BUILDERS has the largest pool and highest concentration
    • DAPPS & APPS typically has more projects but more evenly distributed funding
    • WEB3 INFRA and DEV TOOLING show moderate concentration
  3. Contribution vs. Matching Relationship: The ratio between contribution amount and matching amount (match ratio) is a critical predictive factor and varies significantly by category.

Limitations

  1. Limited Historical Data: We primarily relied on GG22 data, which might not fully capture evolving trends.

  2. Project Quality Assessment: The model does not directly assess project quality or innovation, which may affect actual funding decisions.

  3. Community Dynamics: Gitcoin funding involves complex community dynamics that are difficult to model precisely.

  4. External Factors: Market conditions, overall cryptocurrency ecosystem health, and other external factors that might influence funding patterns are not incorporated.

Future Improvements

  1. Project Quality Features: Incorporate metrics to assess project quality, such as GitHub activity, team experience, or community engagement.

  2. Time Series Analysis: Develop more sophisticated time series analysis to capture funding trends across multiple rounds.

  3. Community Network Effects: Model the network effects of contributors supporting multiple projects.

  4. Machine Learning Integration: Develop a hybrid approach that combines our statistical model with supervised learning algorithms.

Conclusion

Our Gitcoin Grants 23 prediction model employs a hybrid approach combining statistical modeling, domain expertise, and empirical patterns. By distinguishing between existing and new projects and applying category-specific strategies, we produce realistic funding predictions that respect the unique dynamics of each category while ensuring the total allocated funds match predetermined pool sizes.

The model’s strength lies in its ability to incorporate both historical project performance and broader funding patterns, creating predictions that balance continuity with the competitive nature of Gitcoin Grants funding.


Gitcoin Grants 23 Funding Prediction Model

Submission by: Pond Username: 22je0569

Problem Statement

The goal of this model is to predict the funding amounts for projects in Gitcoin Grants Round 23 (GG23) across four distinct categories:

  • WEB3 INFRA
  • DEV TOOLING
  • DAPPS & APPS
  • MATURE BUILDERS

Each category has a different funding pool, allocation mechanism, and historical pattern. The challenge is to predict how much funding each project will receive based on historical performance data and category-specific dynamics.

Data Sources

Our model utilizes four primary datasets:

  1. gitcoin_round_analysis.csv: Contains round-level metrics including total matching amounts, contribution amounts, number of contributors, and number of projects for each historical Gitcoin round.

  2. gitcoin_project_summary.csv: Provides aggregated statistics for each project across all rounds they’ve participated in, including total contribution amounts and contributor counts.

  3. gitcoin_project_by_round.csv: Contains detailed performance metrics for each project in each round, including matching amounts, contribution amounts, and number of contributors.

  4. projects_Apr_1.csv: The target dataset containing the projects for which we need to make predictions, with project IDs, names, and their respective categories.

Methodology Overview

Our approach to predicting GG23 funding follows these key steps:

  1. Data Analysis and Reference Frame Creation: We analyze historical round data to understand funding patterns, particularly focusing on GG22 rounds as the closest reference.

  2. Project Classification: We distinguish between existing projects with historical data and new projects without prior participation.

  3. Separate Prediction Strategies:

    • For existing projects, we leverage their historical performance.
    • For new projects, we apply power-law distributions informed by historical patterns.
  4. Category-Specific Modeling: Each funding category (WEB3 INFRA, DEV TOOLING, etc.) is modeled separately due to their unique characteristics.

  5. Pool Normalization: We ensure that the total predicted funding across all projects in a category exactly matches the predetermined pool size.

Feature Engineering and Data Preparation

Reference Data Preparation

Instead of using a conventional machine learning approach with feature matrices, we created category-specific reference data based on GG22 rounds:

def prepare_reference_data(round_analysis, project_by_round):
    # Filter for relevant GG22 rounds
    gg22_rounds = round_analysis[
        (round_analysis['Gitcoin Grants #'] == 22) & 
        (
            round_analysis['Round Name'].str.contains('Infrastructure', case=False) |
            round_analysis['Round Name'].str.contains('Developer', case=False) |
            round_analysis['Round Name'].str.contains('dApp', case=False) |
            round_analysis['Round Name'].str.contains('Apps', case=False)
        )
    ]
    
    # Create mapping for our target categories
    category_mapping = {
        'WEB3 INFRA': {'pattern': 'Infrastructure', 'match_ratio': None, 'pool': 200000},
        'DEV TOOLING': {'pattern': 'Developer', 'match_ratio': None, 'pool': 200000},
        'DAPPS & APPS': {'pattern': 'dApp|Apps', 'match_ratio': None, 'pool': 200000},
        'MATURE BUILDERS': {'pattern': None, 'match_ratio': 5.0, 'pool': 600000}
    }

Key features derived from historical data include:

  1. Match Ratio: The ratio between matching amount and contribution amount for each category.
  2. Reference Round Distribution: The distribution of funding within each reference round, including percentiles and top-performer statistics.
  3. Project History: For existing projects, we extract:
    • Average contributors per round
    • Average contribution amount per round
    • Historical matching percentages within rounds

Project Type Identification

We classify projects as either existing (with historical data) or new:

def identify_project_types(target_projects, project_summary):
    historical_projects = set(project_summary['Gitcoin Project Id'].unique())
    target_projects['has_historical_data'] = target_projects['PROJECT_ID'].isin(historical_projects)

This binary feature is crucial as it determines which prediction strategy to apply.

Model Design

Rather than using traditional ML algorithms, we employed a hybrid approach combining statistical modeling, domain knowledge, and empirical patterns observed in Gitcoin Grants data.

Model for Existing Projects

For projects with historical data:

  1. Contributor Prediction:

    avg_contributors = historical_data['# of Contributors'] / historical_data['Num_Rounds_Participated']
    predicted_contributors = int(avg_contributors * (0.8 + 0.4 * np.random.random()))
    
  2. Contribution Amount Prediction:

    avg_per_contributor = avg_contribution / avg_contributors if avg_contributors > 0 else 2.0
    predicted_contribution = predicted_contributors * avg_per_contributor
    
  3. Matching Amount Prediction:

    match_ratio = category_mapping[target_round]['match_ratio']
    predicted_matching = predicted_contribution * match_ratio
    

For the MATURE BUILDERS category (which has no contributions, only matching), we use a different approach:

avg_matching_percent = np.mean([
    amount / total * 100 
    for amount, total in zip(
        round_appearances['Matching Amount'], 
        round_appearances['Matching Amount_round_total']
    )
])

percent_of_pool = min(avg_matching_percent * (0.8 + 0.4 * np.random.random()), 15)
predicted_matching = category_mapping[target_round]['pool'] * (percent_of_pool / 100)

Model for New Projects

For projects without historical data, we apply a power-law distribution based on empirical observations that Gitcoin funding typically follows such patterns:

# Apply a power-law distribution to allocate the remaining pool
ranks = np.arange(1, len(new_projects) + 1)

# Determine power-law exponent based on round type
if round_category == 'DAPPS & APPS':
    exponent = 1.2  # Less extreme distribution for many projects
elif round_category == 'MATURE BUILDERS':
    exponent = 1.5  # More concentrated distribution
else:
    exponent = 1.3  # Medium concentration
    
# Generate raw allocations
raw_allocations = 1.0 / (ranks ** exponent)
normalized_allocations = (raw_allocations / raw_allocations.sum()) * remaining_pool

The power-law exponents were carefully selected based on:

  1. Historical funding concentration in each category
  2. The number of projects in each category
  3. The degree of concentration observed in GG22 equivalent rounds

Model Optimization

Category-Specific Tuning

We optimized our model parameters for each category separately:

  1. Power-law exponents: Different exponents for each category based on observed funding concentration:

    • DAPPS & APPS: 1.2 (more evenly distributed)
    • WEB3 INFRA and DEV TOOLING: 1.3 (medium concentration)
    • MATURE BUILDERS: 1.5 (more concentrated)
  2. Randomization factors: To account for natural variation in funding patterns, we introduced controlled randomness:

    predicted_contributors = int(avg_contributors * (0.8 + 0.4 * np.random.random()))
    

    This creates a range of 80%-120% of the historical average.

Pool Normalization

The model ensures the total predicted funding matches the established pool size for each category:

def normalize_predictions(predictions, category_mapping):
    for round_category, info in category_mapping.items():
        round_projects = predictions[predictions['ROUND'] == round_category]
        if len(round_projects) == 0:
            continue
            
        # Calculate current total matching amount
        current_total = round_projects['predicted_matching_amount'].sum()
        
        # Calculate scaling factor
        scaling_factor = info['pool'] / current_total
        
        # Apply scaling to all projects in this round
        for idx in round_projects.index:
            predictions.loc[idx, 'predicted_matching_amount'] *= scaling_factor

This normalization step is crucial for ensuring that predictions are realistic and conform to known funding constraints.

Model Evaluation and Validation

Without a labeled test set, we employed several validation strategies:

  1. Historical Pattern Consistency: We verified that our predictions followed similar distributions to those observed in GG22 rounds.

  2. Domain-Specific Validation:

    • The predicted ratio of top project funding to average project funding aligned with historical patterns
    • The power-law distribution of project funding matched empirical observations
  3. Reality Checks:

    • We ensured no single project received more than 15% of a category’s pool
    • We verified that all matching amounts were positive and realistic

Key Insights and Model Limitations

Insights

  1. Existing vs. New Project Dynamics: Existing projects with historical data tend to receive more predictable funding, while new projects follow a more competitive power-law distribution.

  2. Category-Specific Patterns: Each funding category shows distinct characteristics:

    • MATURE BUILDERS has the largest pool and highest concentration
    • DAPPS & APPS typically has more projects but more evenly distributed funding
    • WEB3 INFRA and DEV TOOLING show moderate concentration
  3. Contribution vs. Matching Relationship: The ratio between contribution amount and matching amount (match ratio) is a critical predictive factor and varies significantly by category.

Limitations

  1. Limited Historical Data: We primarily relied on GG22 data, which might not fully capture evolving trends.

  2. Project Quality Assessment: The model does not directly assess project quality or innovation, which may affect actual funding decisions.

  3. Community Dynamics: Gitcoin funding involves complex community dynamics that are difficult to model precisely.

  4. External Factors: Market conditions, overall cryptocurrency ecosystem health, and other external factors that might influence funding patterns are not incorporated.

Future Improvements

  1. Project Quality Features: Incorporate metrics to assess project quality, such as GitHub activity, team experience, or community engagement.

  2. Time Series Analysis: Develop more sophisticated time series analysis to capture funding trends across multiple rounds.

  3. Community Network Effects: Model the network effects of contributors supporting multiple projects.

  4. Machine Learning Integration: Develop a hybrid approach that combines our statistical model with supervised learning algorithms.

Conclusion

Our Gitcoin Grants 23 prediction model employs a hybrid approach combining statistical modeling, domain expertise, and empirical patterns. By distinguishing between existing and new projects and applying category-specific strategies, we produce realistic funding predictions that respect the unique dynamics of each category while ensuring the total allocated funds match predetermined pool sizes.

The model’s strength lies in its ability to incorporate both historical project performance and broader funding patterns, creating predictions that balance continuity with the competitive nature of Gitcoin Grants funding.

GG23 Predictive Funding Challenge

Pond AI Platform email: sirgavila@gmail.com

Overview

In this project, I explored the prediction of funding outcomes for Gitcoin grant proposals using an alternative approach that combines structured data with lightweight natural language processing techniques. The goal was to estimate the total contribution amount each project would receive in a specific funding round.

Rather than relying solely on traditional tabular features, I included semantic cues from project titles and descriptions, and used XGBoost, a gradient boosting algorithm known for its scalability and accuracy.

Workflow Breakdown

1. Dataset Integration and Preprocessing

  • Data Sources: Combined structured CSV exports from Gitcoin with metadata scraped from public project pages.
  • Missing Data Handling: Null fields were filled using mode values or flagged as “missing” to retain information.
  • Datetime: Created a new features with different combinations of the datetime data.

2. Natural Language Feature Extraction

  • TF-IDF Vectors: Extracted unigram and bigram TF-IDF vectors from the project titles and summaries.
  • Sentiment Scores: Applied VADER sentiment analysis to each grant description to quantify positivity or negativity.
  • Keyword Density: Checked for keywords like “public good”, “open source”, “web3”, which historically correlate with stronger community support.

These text features were concatenated with numeric fields into a unified model input matrix.

3. Feature Selection

  • Conducted recursive feature elimination using a baseline XGBoost model to reduce feature count from 38 to 17
  • Top features included:
    • Number of Contributors
    • Sentiment Score
    • Contribution per Contributor

4. Modeling

  • Used XGBoost Regressor
  • Performed 5-fold cross-validation to ensure stability.

5. Model Performance

  • Validation RMSE: 3987.32

Takeaways

This model illustrates that Gitcoin funding outcomes can be reasonably predicted with a mix of numerical metadata and lightweight textual analysis.

This work provides a complementary perspective to traditional regression models and underlines the potential of hybrid ML + NLP solutions for web3 funding ecosystems.