This is in response to this bounty to analyze gitcoin grants.
My analysis is a jupyter notebook in this github repo or google colab and it consists of 2 stages.
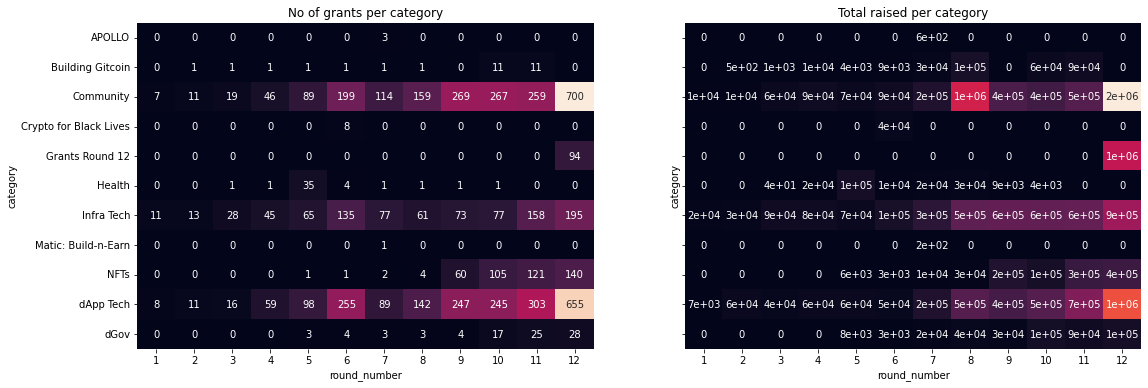
The first stage looks for the trends from GR1 to GR12. It is obvious that things are getting bigger and bigger such as number of grants, match amount, contributions and total funds. I also included the average total funds raised and how categories and regions have evolved. Then there’s wordcloud to visualize vocabulary of grant titles.
The second stage is to compare quadratic funding (QF) with a single pool for GR12 with category funding (CLF) in GR11 and GR10. The first discovery is that there are a lot of grants that raised $0 in total. This was a point raised here about large skew or variance in the amount raised by grants as we see the match amount, contribution, and total raised by a single project reach their peak in GR12.
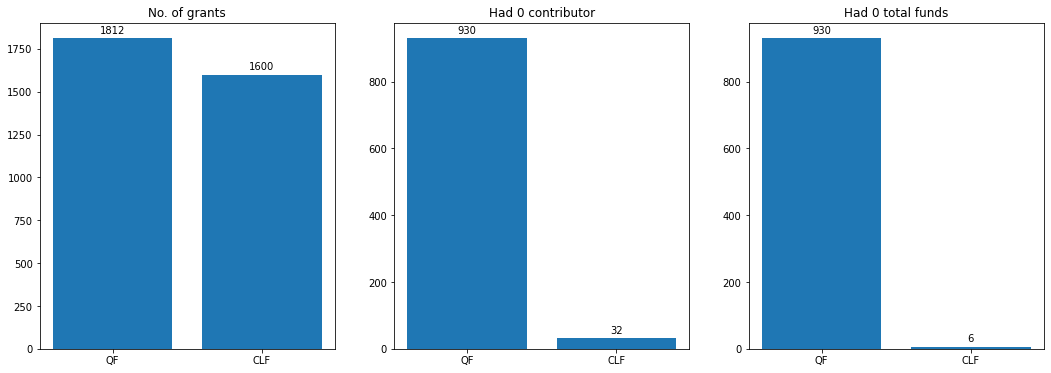
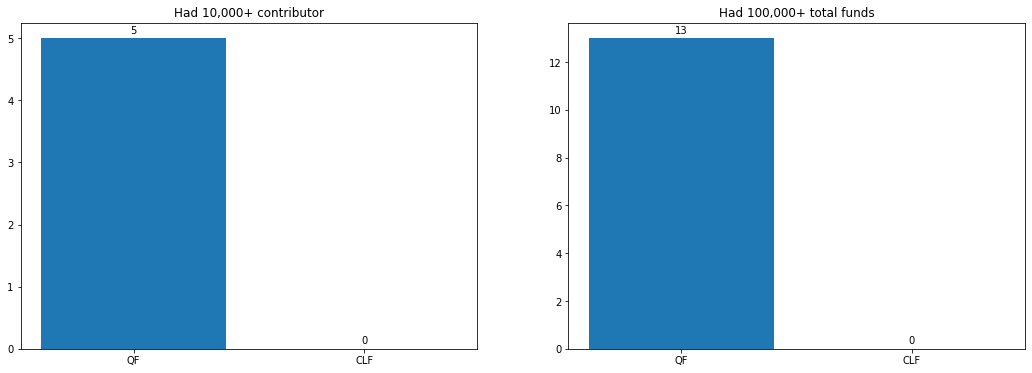
The analysis resolves the debate about whether there would be skew or not in this post’s comments. It is important to note that funds were distributed between various categories and regions, it is some individual projects that were hurt. There’s a talk about variance for public good funding here and it seems that’s the essence of quadratic funding. But I think there’s probably a need for discussion on how a large number of projects had 0 contributors and therefore 0 funding and if a large skew is what we want.
Please note that the GR12 with 0 total are empty in the original dataset (as I filled Nans with 0). But they have 0 num_unique_contributors and $0 match_amount (and somehow have 1 or 2 num_contributions). So clarity from @owocki would be needed.