This report is divided into two parts:
-
Part 1 shows some descriptive stats over the period GR1 to GR12, including contributions, grants and funds.
-
Part 2 is a longitudinal analysis of the Quadratic Funding (QF) mechanism
Part 1. Descriptive Stats
1.1 Grant&Contribution
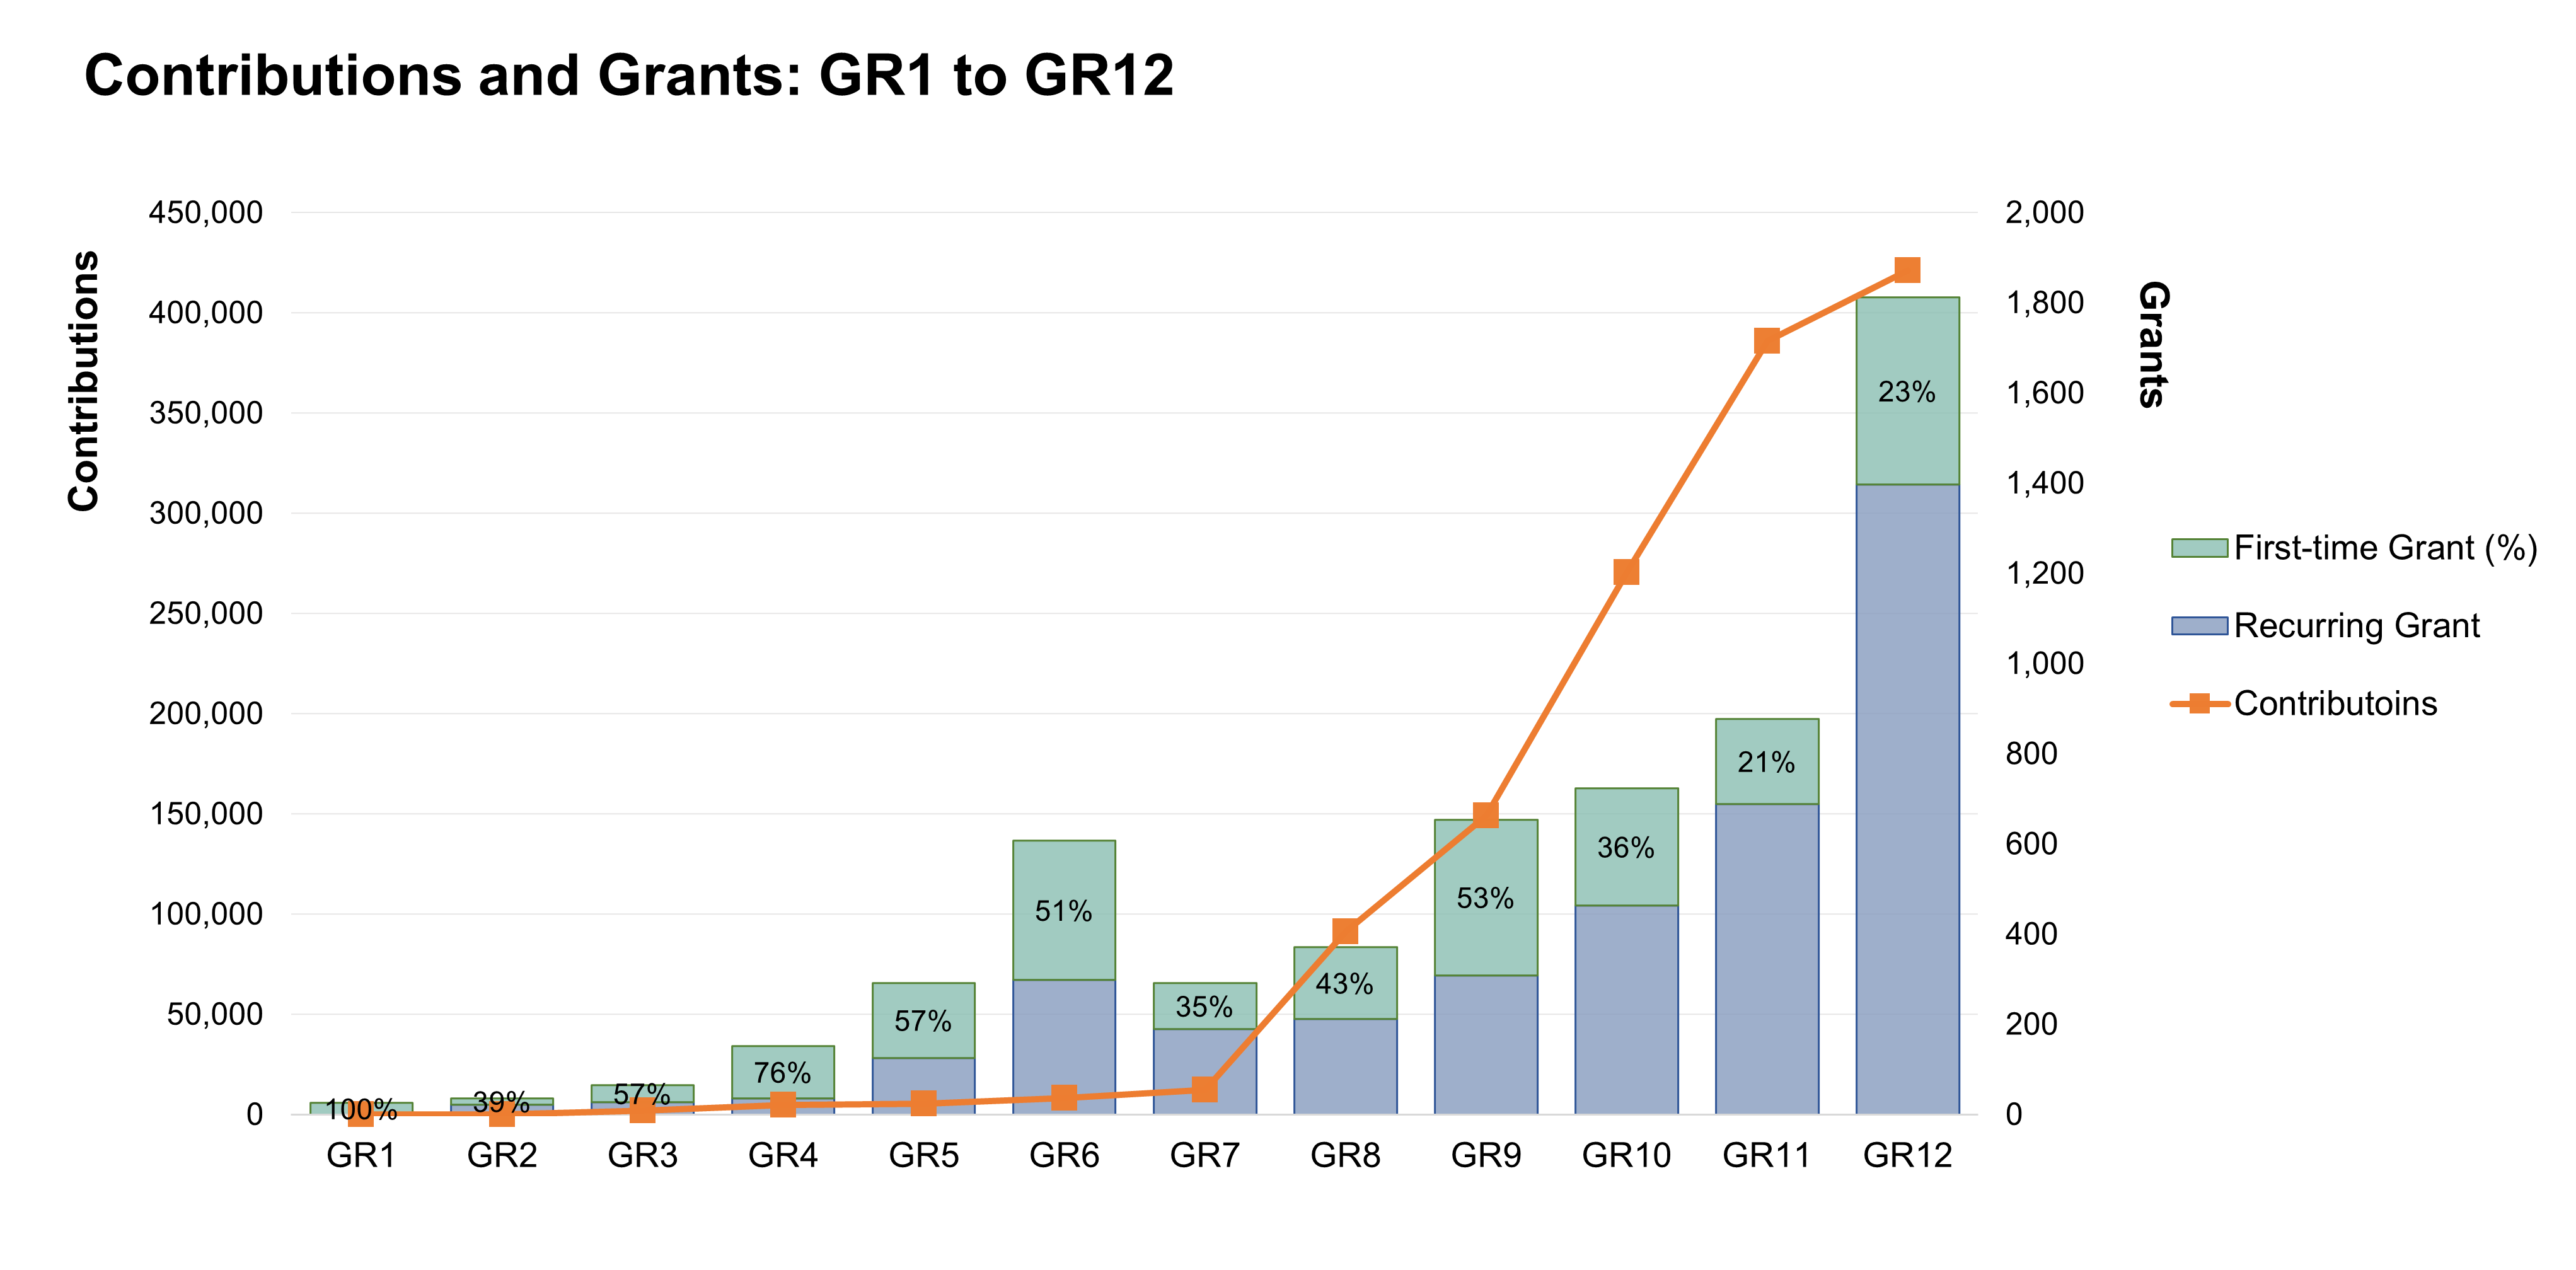
*The percentage shown is calculated by #first-time grant/#total grants
Overall, both contribution and grant witnessed a significant increase from GR1 to GR12. The most dramatic increases in contributions started from GR 7. In addition, the proportion of the first-time grant peaked in GR6 (51%), and it tended to fluctuate over the period shown. In the latest round (GR12), the number of grants rose to more than 1800, among which first-time grants accounted for about a quarter.
1.2 Amount Raised:
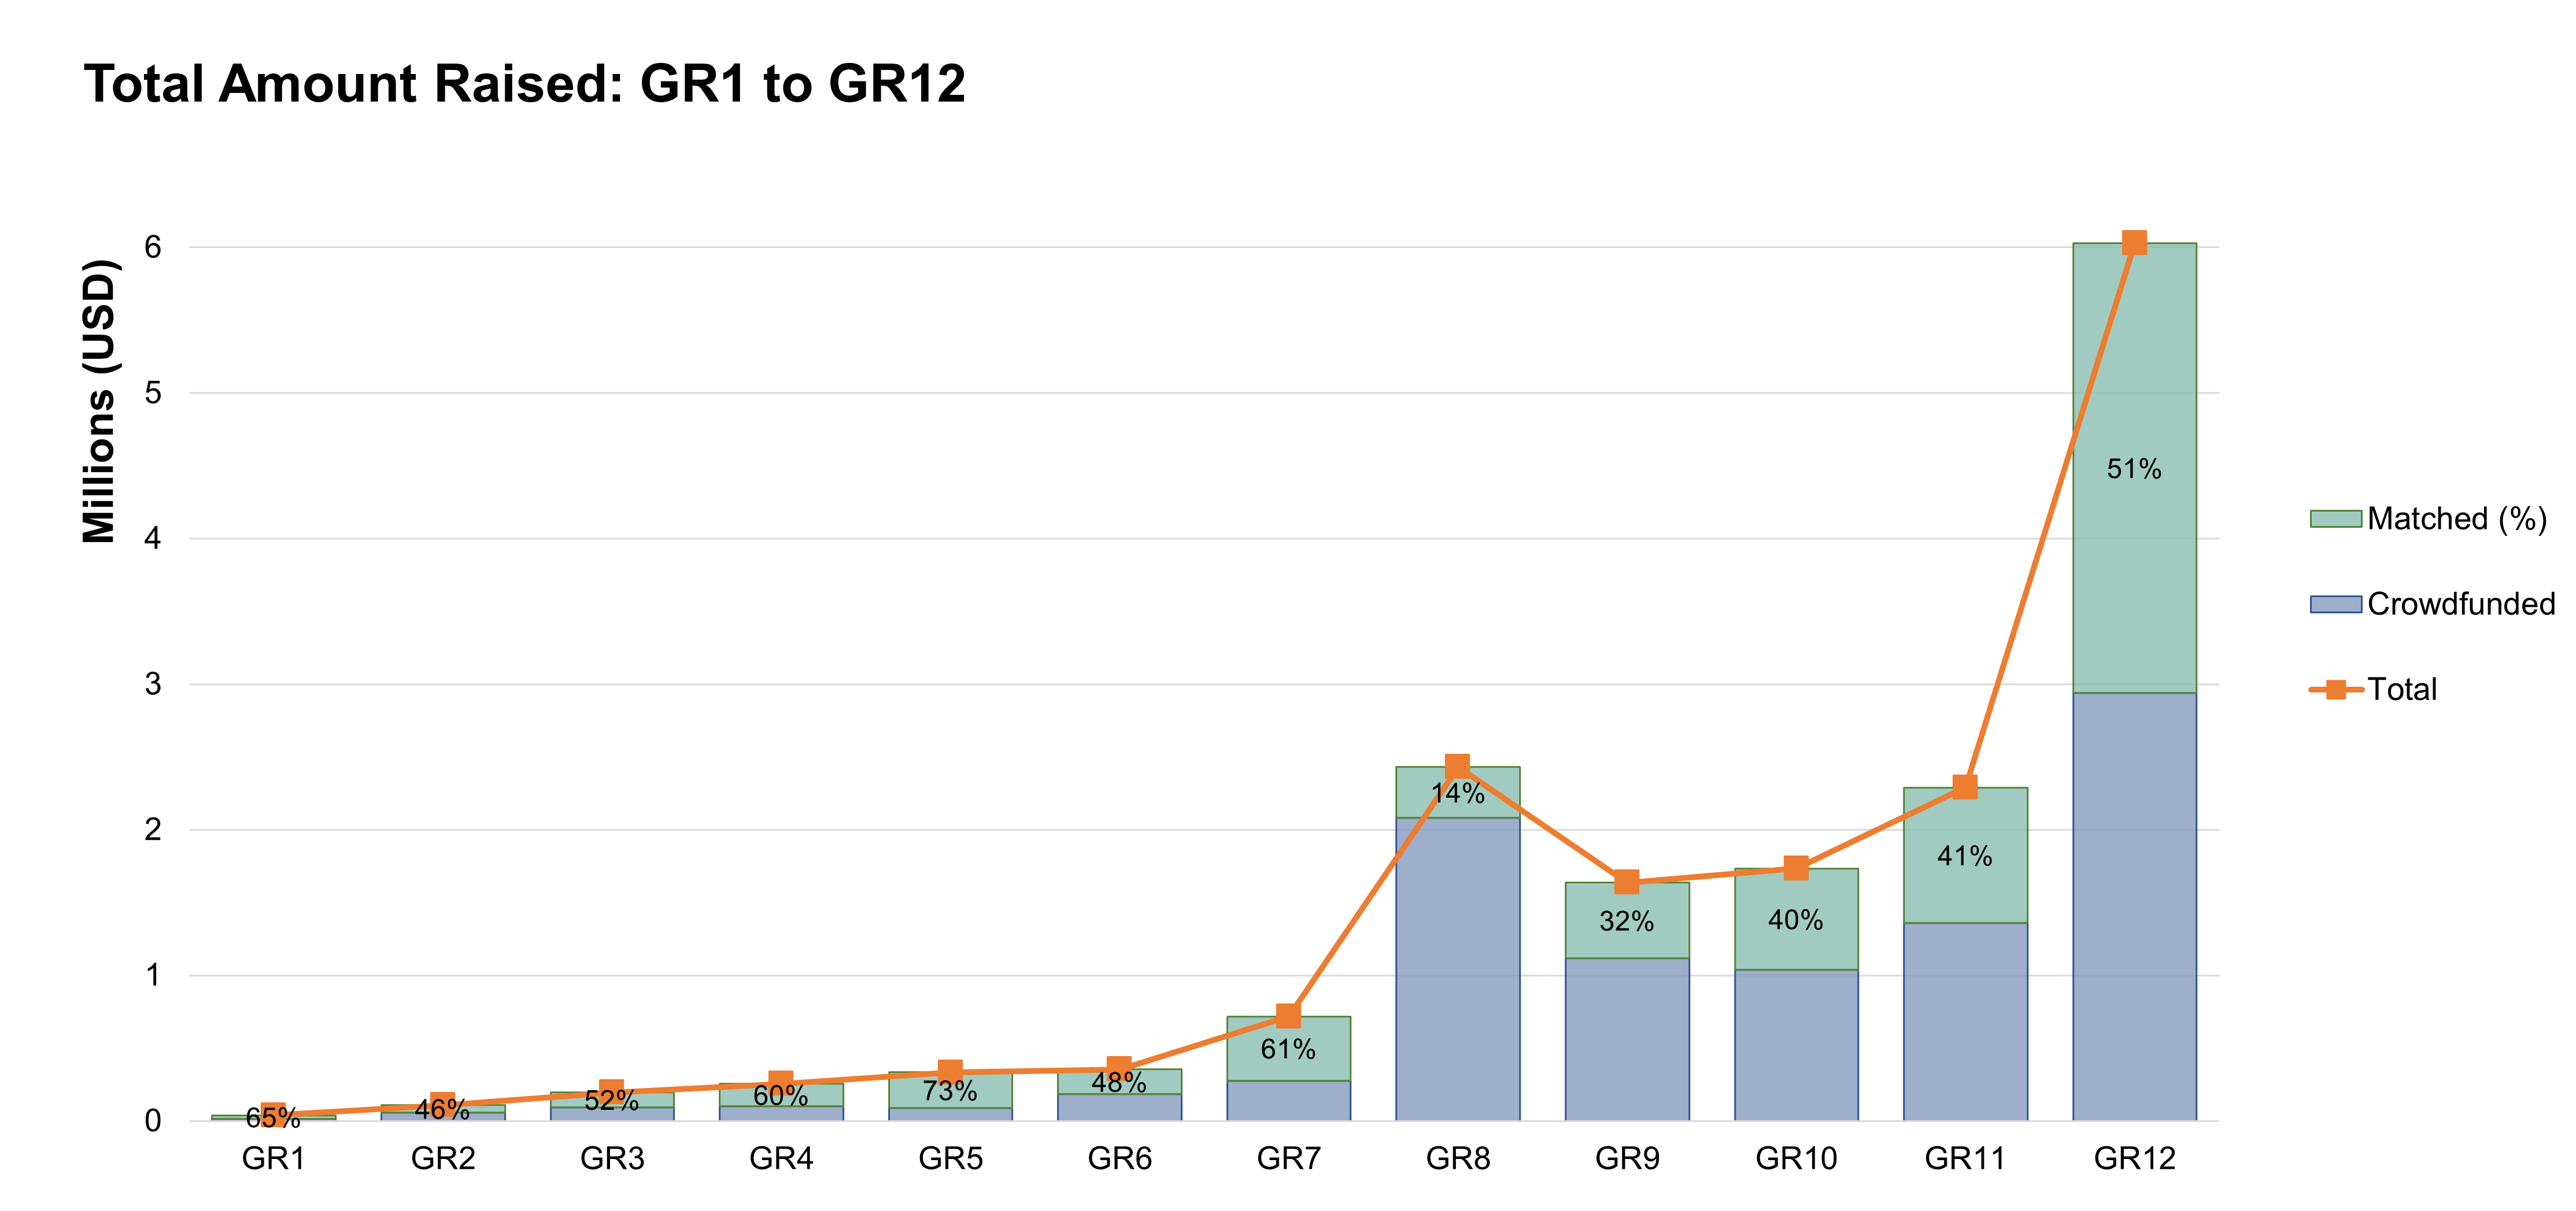
*The percentage shown is calculated by matched amount/total amount
The fund raised also saw a clear increasing trend, despite a fluctuation among GR9 to GR11. In GR12, a total of $6.1M were raised, both the matched and crowdfunded amount achieved all-time highs, nearly tripled compared with the last round. Moreover, the proportion matched fund peaked in GR7(61%) and fluctuated throughout the whole period.
1.3 Grants by Category
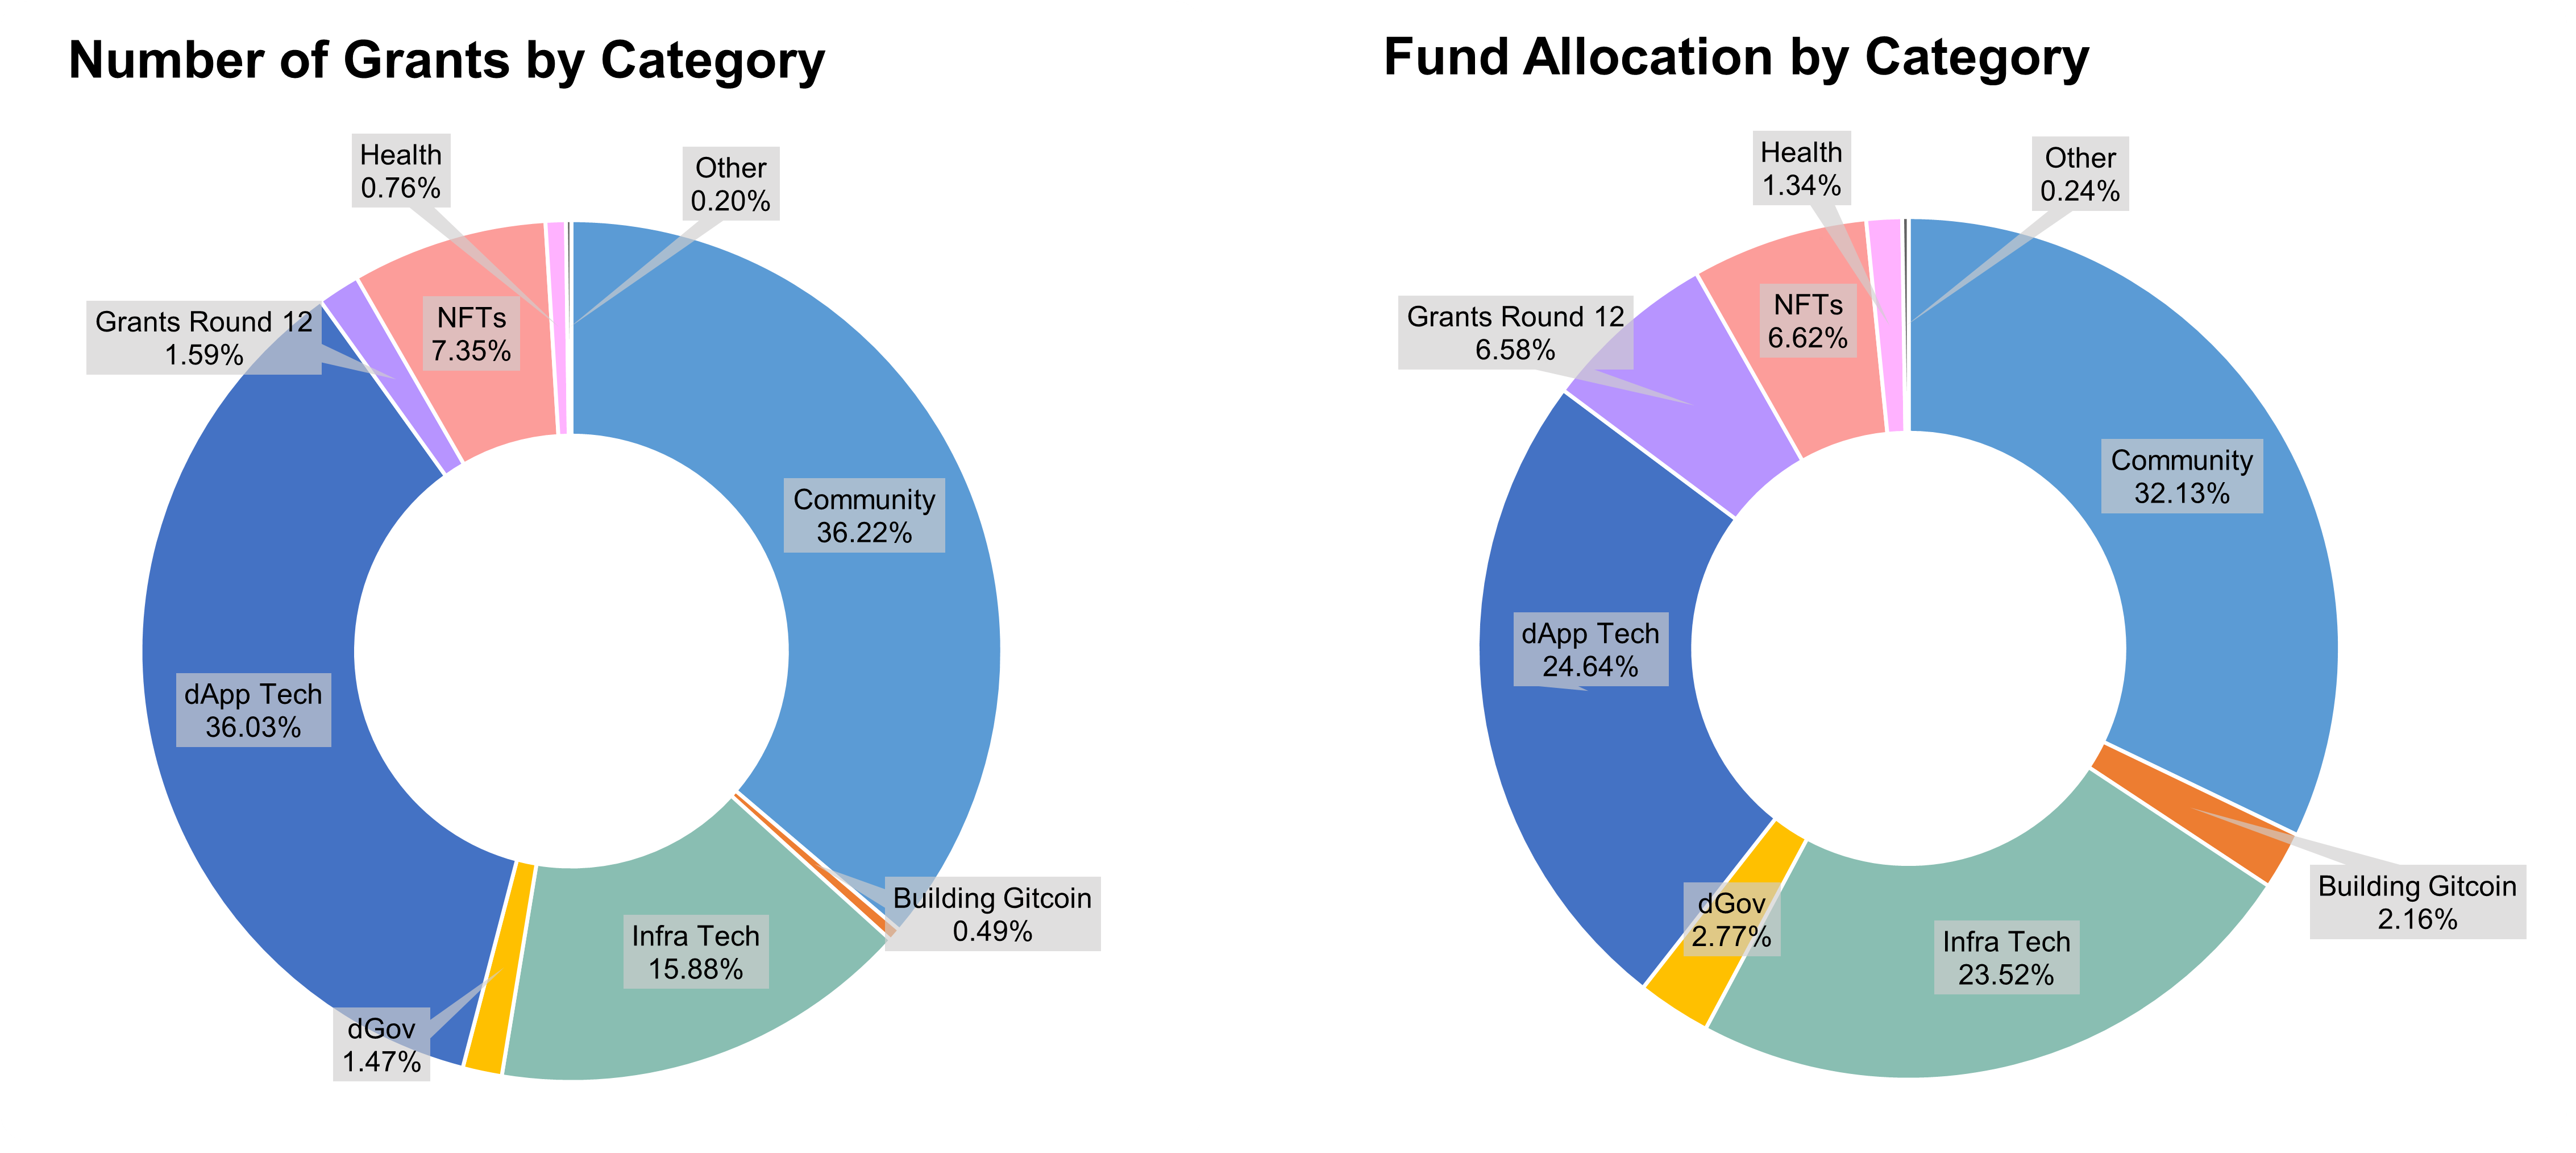
Grants of ‘community’ accounted for the greatest part both in numbers and amount raised. ‘DAPP tech’ and ‘infra tech’ placed second and third, respectively.
1.4 Grants by Region
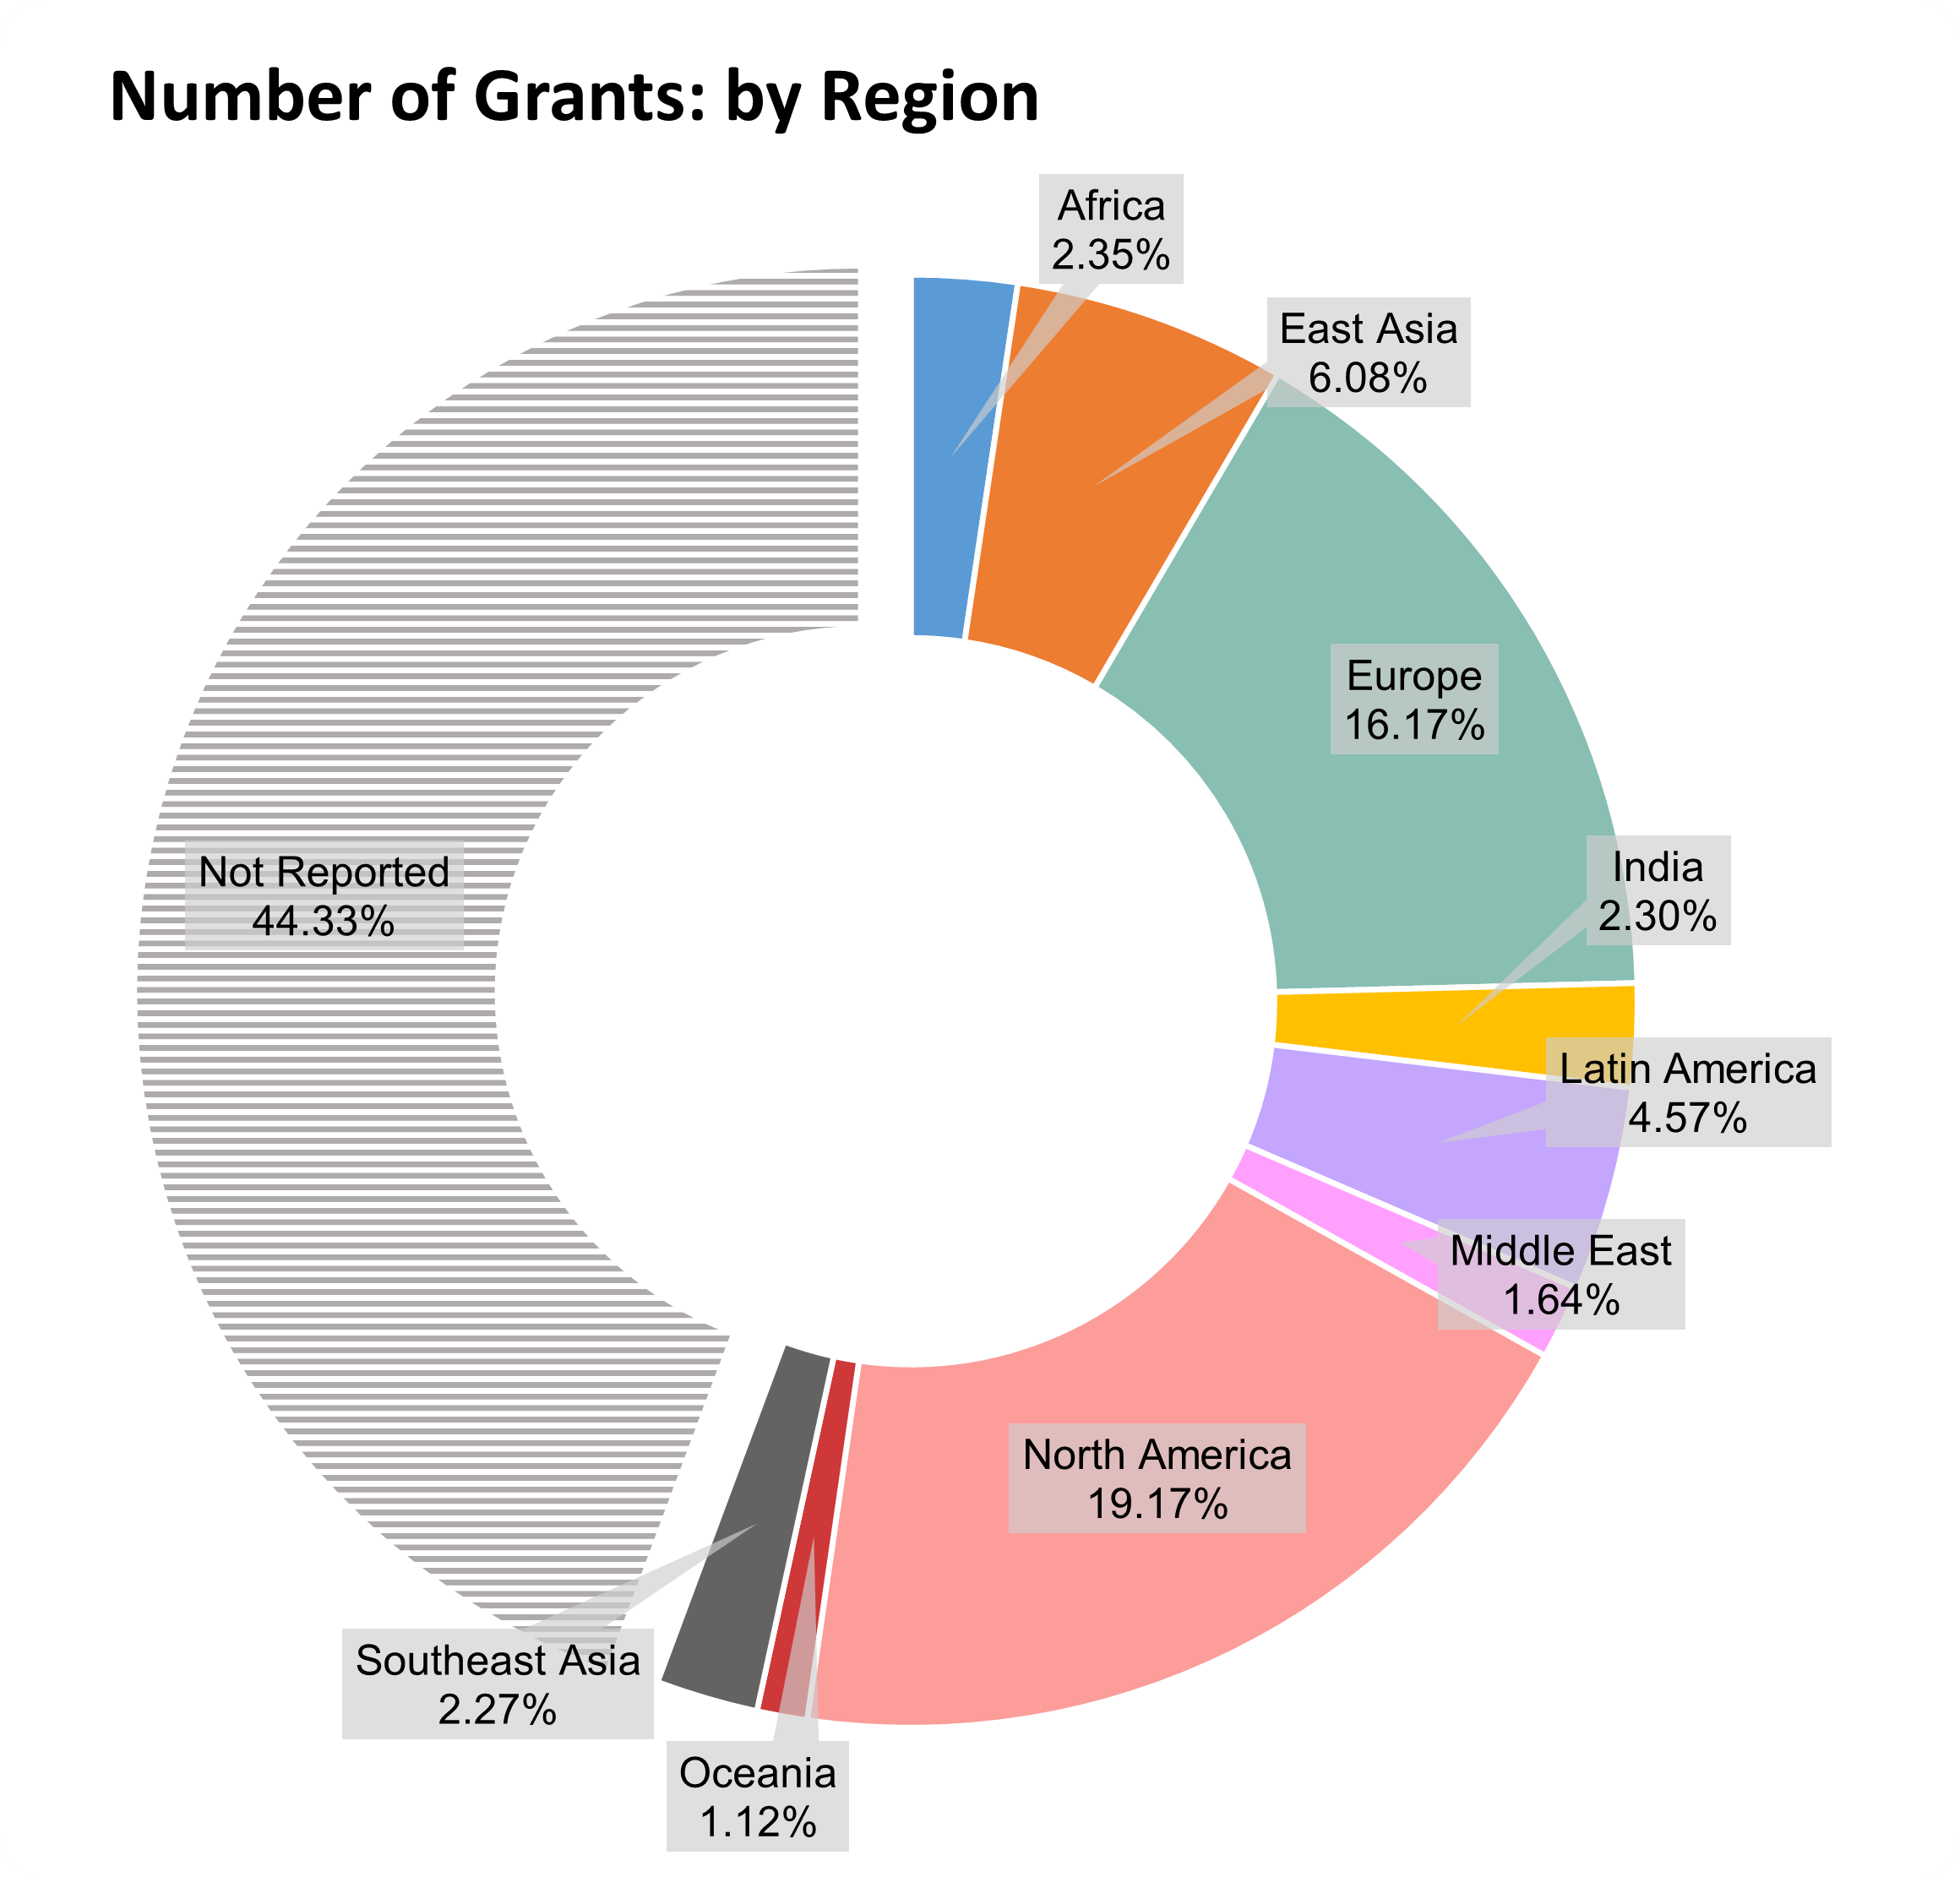
Information on location was not reported for about 44% grants. By looking at the available location data, North America, Europe and East Asia were the top three regions on the number of grants. In addition, the growth of grants extended to all continents of the world by GR6.
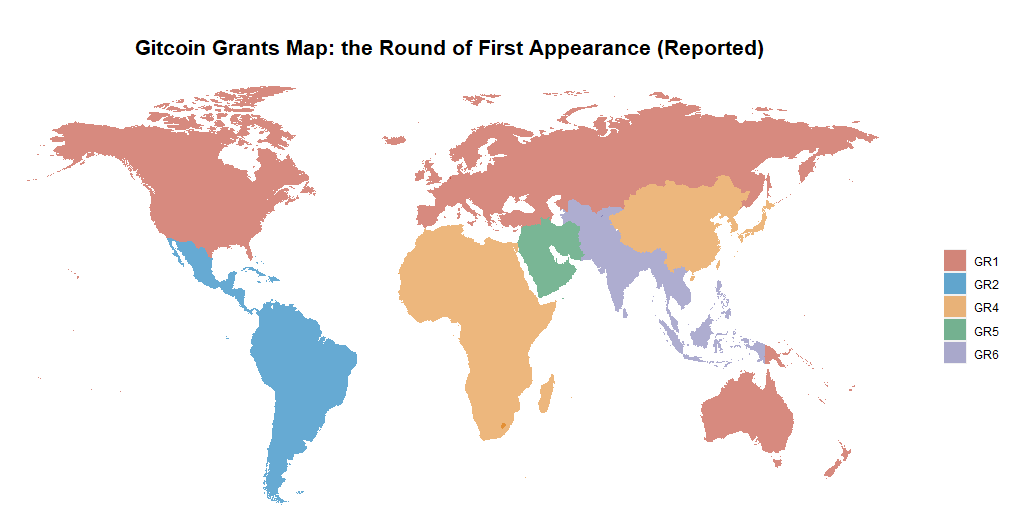
*GR1: North America, Europe, Oceania; GR2: Latin America; GR4: East Asia, Africa; GR5: Middle East; GR6: India, Southeast Aisa
Part 2. A Longitudinal Analysis on Quadratic Funding
Gitcoin is currently the largest experiment of Quadratic Funding (QF): for each grant, the amount of funding to be awarded is a sum of the amount raised by crowdfunding and the matched amount according to the QF algorithm.
Now, let look at the distribution&percentile of crowdfunded amount, matched amount and the total amount one by one.
2.1 Crowdfunded Amount by Grants
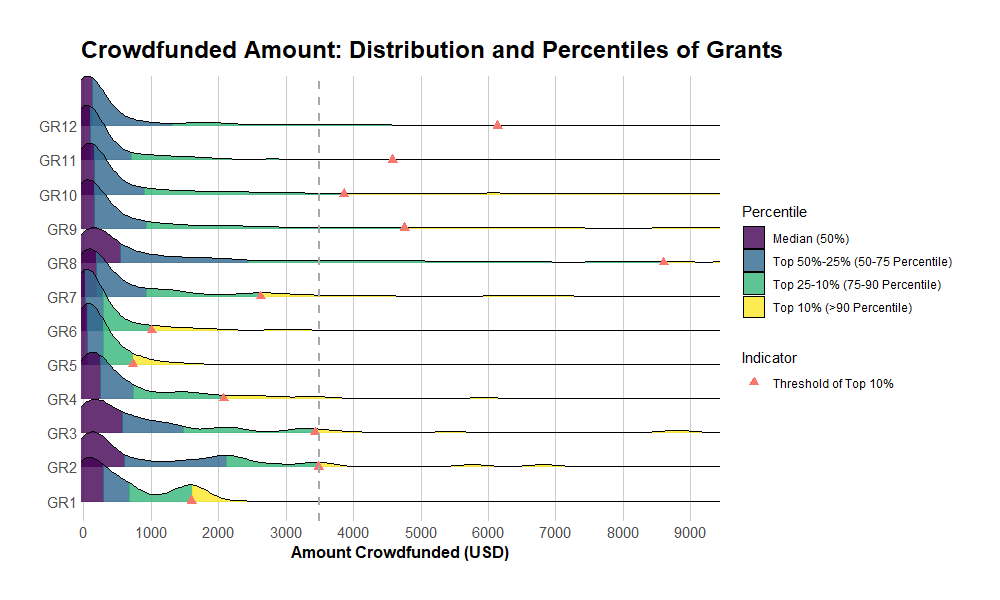
*As the curve for the top 10% grants may be difficult to read, an indicator was used to show its threshold.
In the most recent 4 rounds (GR9-GR12), the patterns of distribution were similar. The median amount that a grant raised from crowdfunding moved toward zero, and 50% grants received less than about $150 from crowdfunding. It means the proportion of grants with 0/small crowdfunding amount was increasing.
In contrast, the thresholds of being a top 10% in GR8-GR12 (all >$3500) were higher than those in GR1-7 (all <$3500), indicating the proportion of grants with an extra high crowdfunding amount (>5000) also saw a relative growth in the most recent rounds.
As a result of both trends, the tail of distribution was becoming longer and flatter.
2.2 Matched Amount by Grants
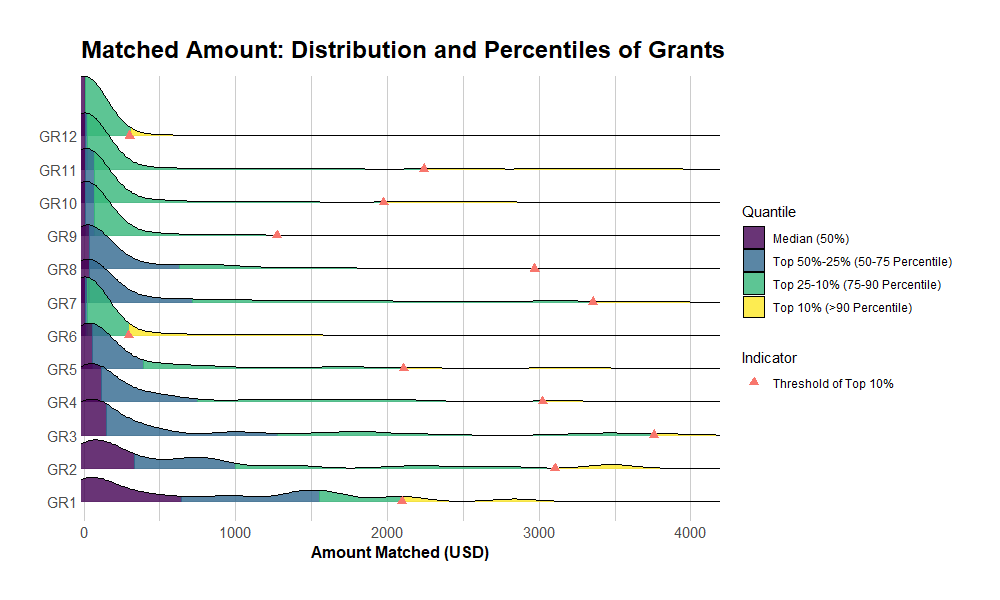
With respect to the distribution of matched amount, its median also showed a trend of moving toward zero. The first 3 quarters (75 percentile) of grants were limited within a narrow interval in the latest 4 rounds.
The threshold of the top 10% for GR12 was very low compared with other recent rounds. One potential reason is the introduction of ‘2.5% cap’ policy in GR12 - ‘To prevent any grant from dominating the matching pool, a 2.5% cap was imposed to restrict how much any one grant can take from the main round.’ With a certain of matched funds moving from the dominating grants to the rest, the threshold of the top 10% moved backwards to a great extent.
Before looking into the distribution of the total amount awarded, let’s make a comparison of the amount crowdfunded and matched. The ratio of matched amount / crowdfunded amount was calculated and presented:

Through QF, about 10% grants received more money from matching pools than crowdfunding. (1-2 times: 5.8%; 2-5 times 3.86%; >5 times 1.63%)
2.3 Total amount by grants
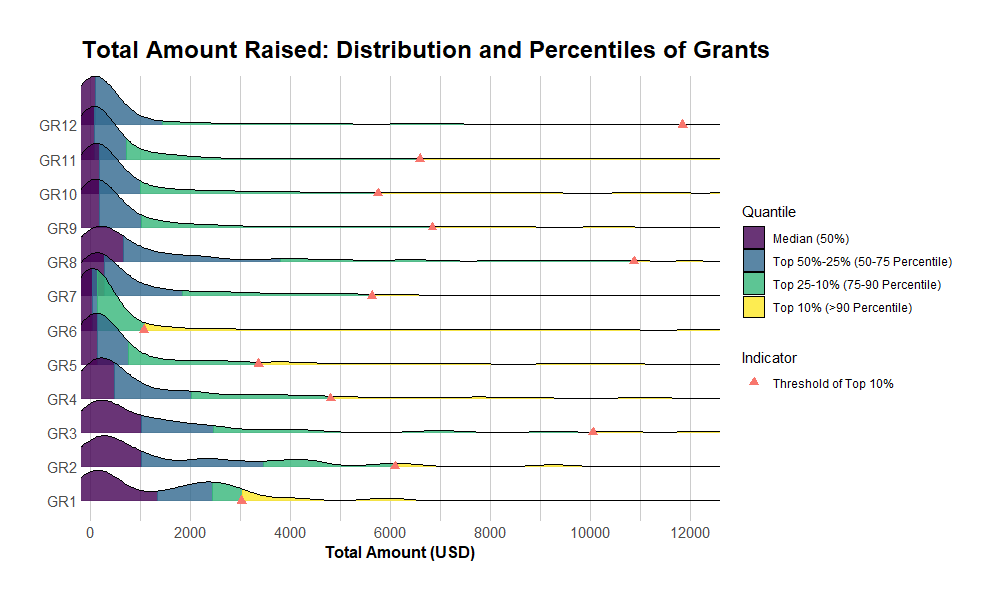
Although the total amount is the combination of both crowdfunded and matched amount, we find its distribution is closer to that of the crowdfunded funds. GR12 saw the highest threshold of top 10% grants, at about $12000.
2.4 Change of the Total Amount over Occur Times
A grant may occur in many grant rounds. As shown below, more than 70% grants were active in more than one round. There are 6 “all-timer” grants who had attended all the 12 rounds: 1. ethers.js - Complete, Simple and Tiny; 2. Lighthouse: Ethereum 2.0 Client; 3. Prysm by Prysmatic Labs; 4. Zero Knowledge Podcast; 5. EthHub - Ethereum Information Hub; 6. Ethereum Cat Herders Community Fund

An interesting question here is to see if the funds raised changed as the increase of occur times. For this purpose, I made the below figure, including all the grants with more than 1 occur time. To show any changes, the ratio of sequent / first-time amount raised was calculated and presented. It was shown on a log scale and categorized by the amount raised at the first time.
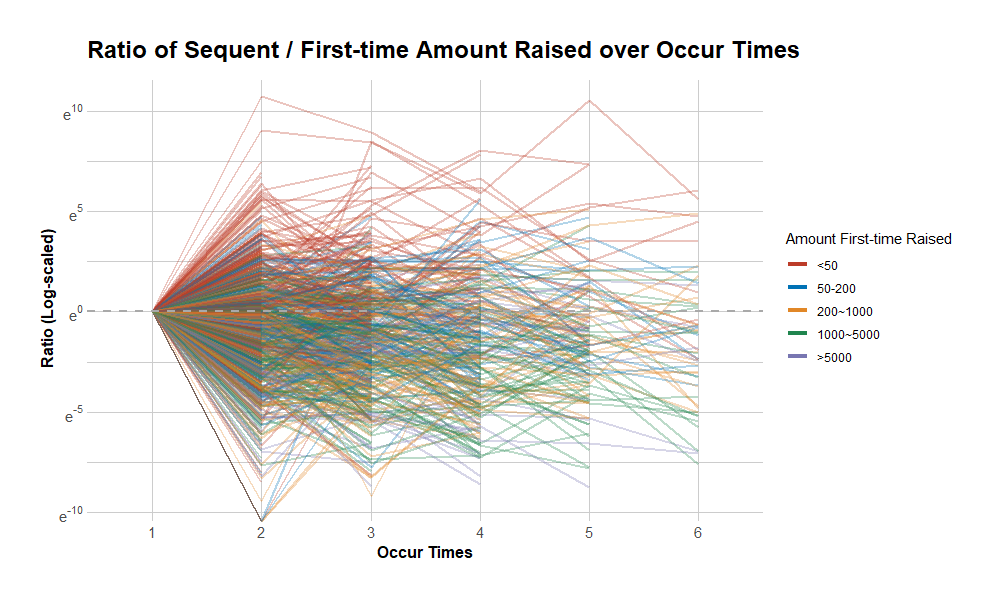
Each line represents a grant and transparency was applied for the overlapped. To further examine any trends over occur times, the ‘loess’ method was used to fit the data, and the estimated curve and corresponding 95% confidential intervals are shown below:
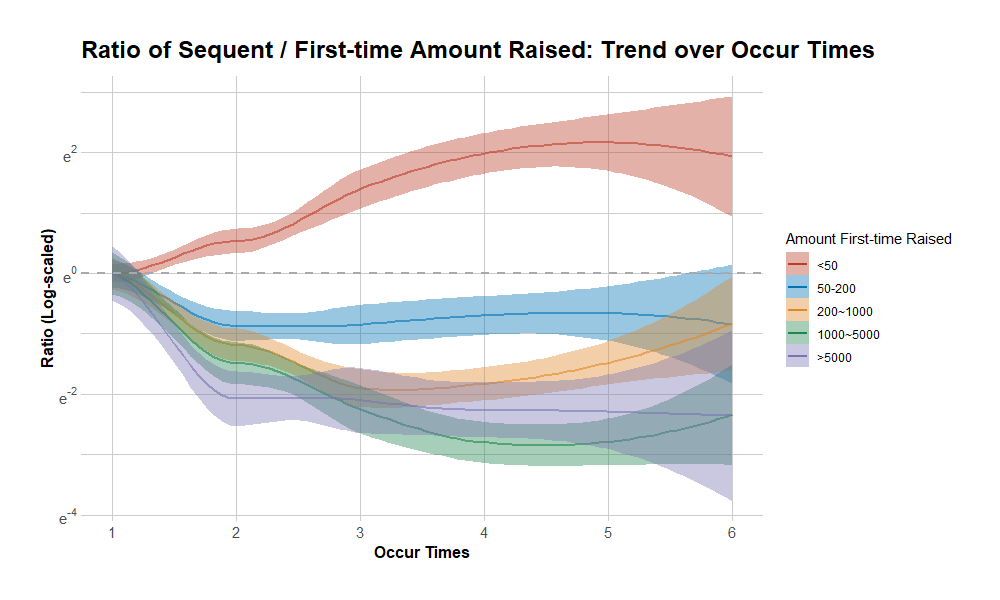
With the increase of occur times, fewer observations were available and the confidential interval became relatively wide.
The trends show the grants beginning with a small amount of fundraising were likely to be awarded more, as they recurring in more rounds. While it might be difficult for a grant to maintain a high-level income in multi rounds.
Summary
-
There have been significant growths in grants, contributions and funds over GR1 to GR12.
-
As an ongoing experiment on the QF, there is still much to be explored and learned. For example, the current mechanism could be more dynamic( taking time factors into account), as we find the amounts a grant raised were not independent between round and round.
Further research can be conducted to optimise the current mechanism when the data on individual contribution is available.