Introduction
This is in response to the GitCoin Grants R1-R12 Analysis Bounty.
The post will cover two types of analysis:
- Cross-Region Trends: Will highlight macro changes in participation across regions. Dashboard Link
- Region Specific Category Trends: Focus on macro-changes in categories at a specific region. Dashboard Link
Intuition:
Since quadratic funding is applied, the match_amount received by any grant can be thought of as a derived value.
Considering this, total funding (which is sum of match amount and crowdfund amount) and match amount are given less attention over region, unique_contributors and crowdfund_amount.
Thus we take a dig at the the wider crypto ecosystem part of the problem statement in the bounty.
1. Cross-Region Trends
Description of the Data
- x-axis: Grant Round for each data is plotted above
- y-axis: It represents three different values showing the percentage distribution across different regions for each value. The values shown are:
- % Unique Grant Request: Percentage of Unique Grants for the region in the specific round
- % Unique Contributors: Percentage of Unique Contributors Found for the region in the specific round
- % Crowdfund Contributions: Percentage of Crowdfund Amount given to grants in a region in the specific round
- Did people become more comfortable sharing their region details?
- Did not revealing region information show possible signs of distrust? Or was their any event or potential scam that made people vary?
- Length of grant title
- Frequently used words in grants with higher engagement
- Buzzword Analysis
- Semantic Analysis of the title to determine how intuitive or catchy the title could be
- length of text
- overall sentiment score of the text
- Usage of hot words
- Relevance to categories promoted by the platform in the specific round
Thus, for each round, the total of any metric always scaled to 100.
Note: Since a contributor may fund more than one grant request, % Unique Contributors doesn’t necessarily represent Unique Contributors in the complete ecosystem. Since the analysis deals with region-specific trends across rounds, impact of this should be minimal.
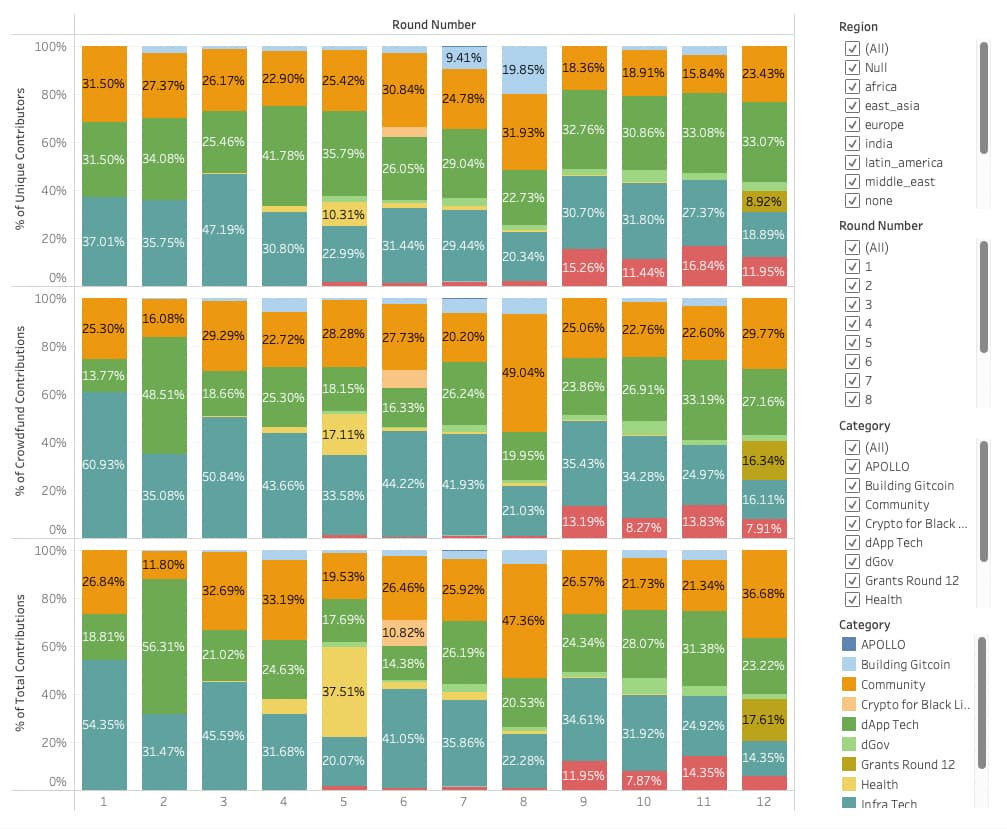
1.1 All Regions
The most obvious insight from the graph above is the relative reduction in Grants with missing Region details. From round 7 onwards, the proportion of such grants reduce drastically. What's more interesting though, is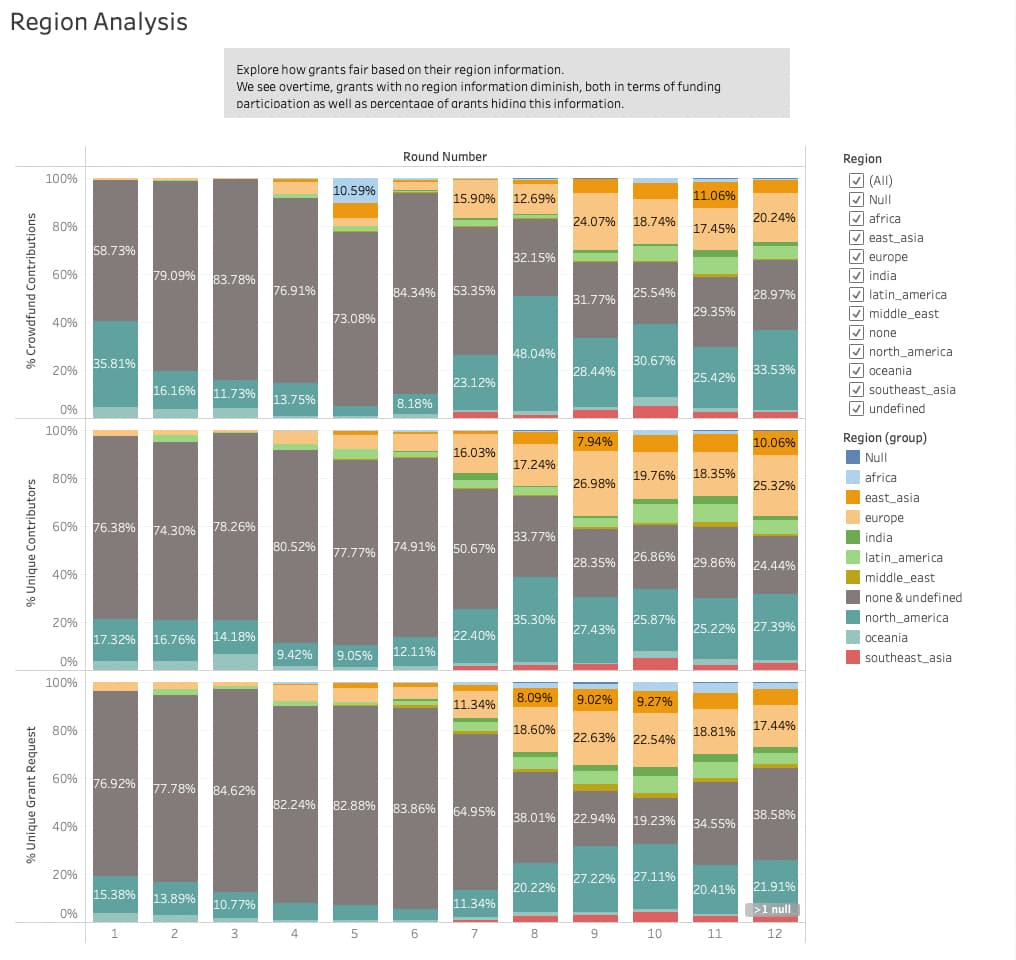
the drop in unique contributions to these projects is more rapid
This hints at further exploration from Round 7 onwards, but intuitively couple of questions come to mind:
It could also be the case that initial projects were region agnostic.
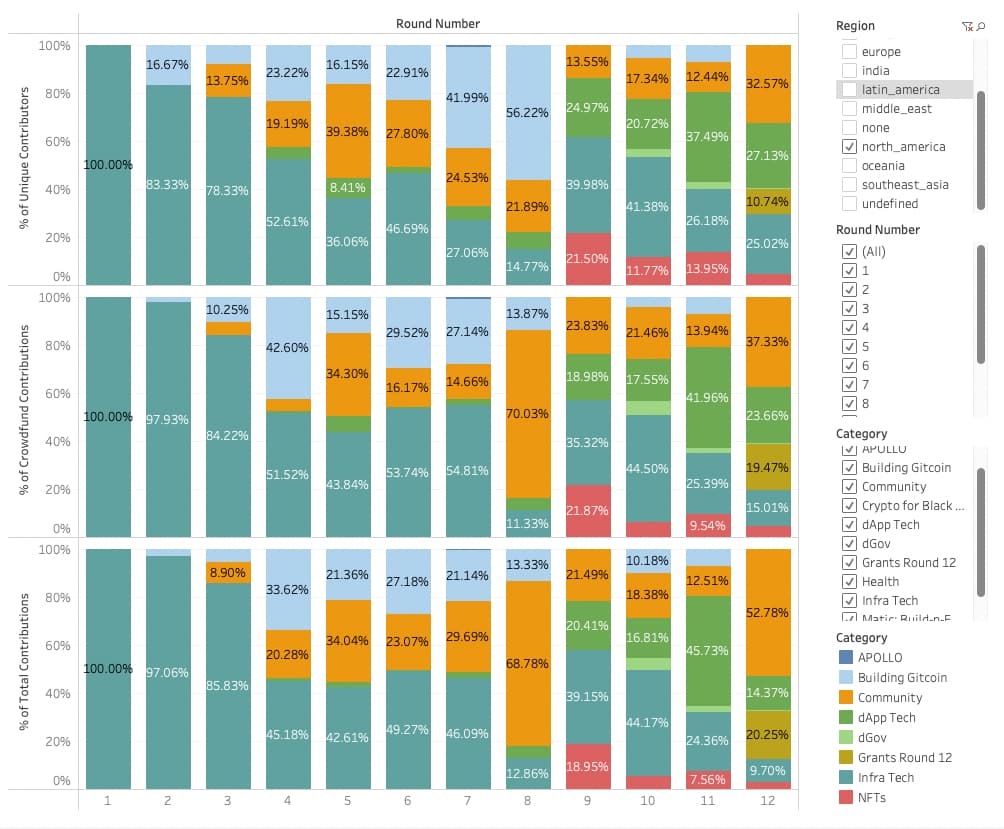
1.2 Removing Missing Region Entries
To get less skewed trends, I decided filter out the entries with missing region.
Now the trends are some what as expected. Initial Rounds were dominated by North America, with active participation from Europe round 3 onwards. I guess America retains the tag of early adopters. Please note that lower percentage of grant request (in a specific round) compared to contributors or crowdfund amount from North America, i.e. more wealth is going to projects from North America, and more grant requests are arising from other regions.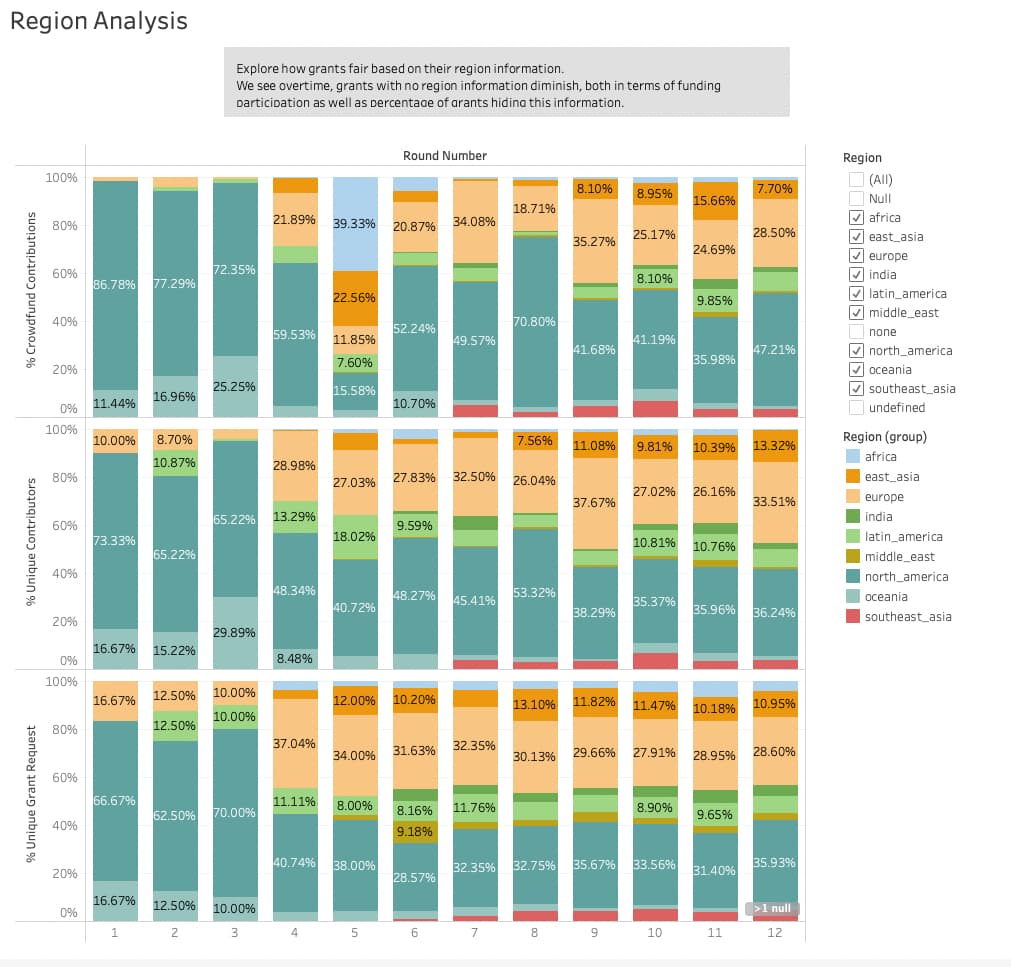
1.3 Removing North America
Let’s remove the Biggest Fish from the sea and see who else has been making progress.
Now we see something interesting.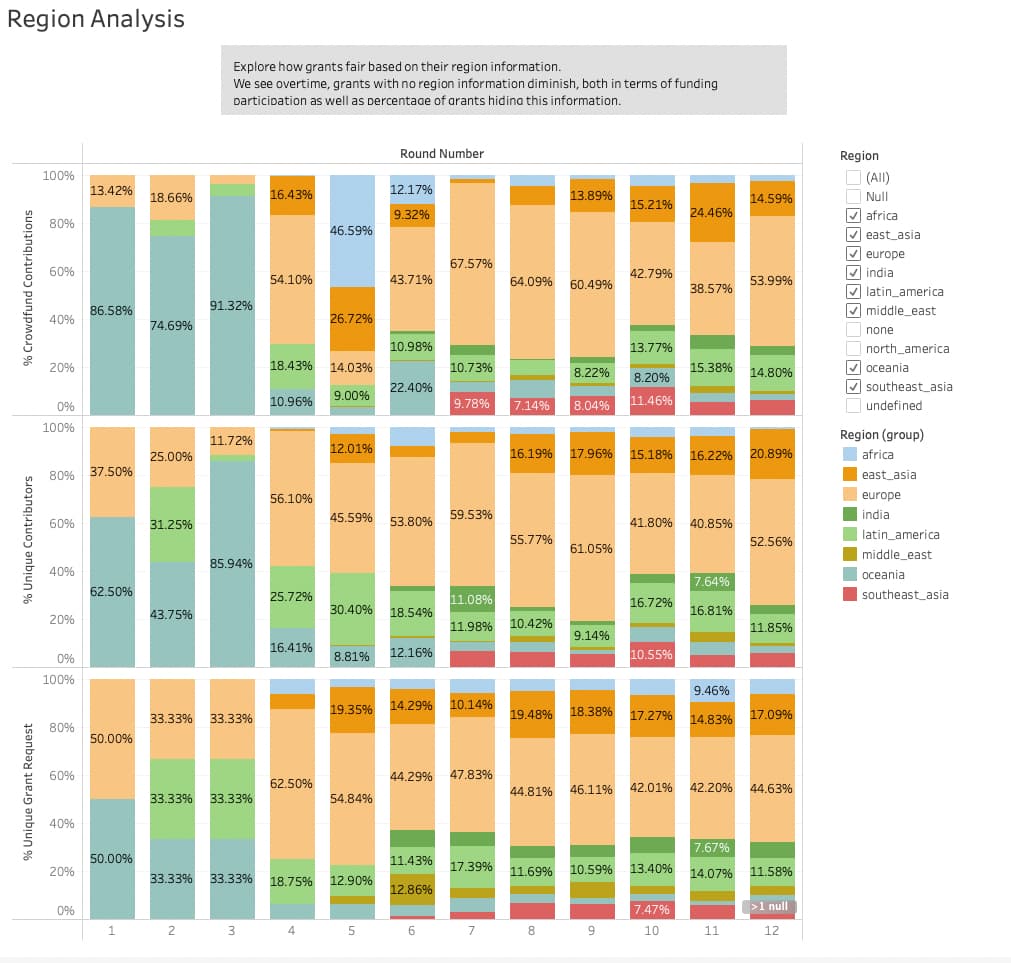
What happened to Oceania?
Rounds 2 and 3 witnessed projects from oceania getting funded significantly in comparison to Europe. The actual number of projects though was 1 each from Europe, Oceania and Latin America.
Round 4 onwards, we see a surge of projects from Europe, which remained till round 12, while oceania struggled to even have a presence.
Does hint at a lack of ecosystem adoption or promotion or resource?
1.4 Removing Europe
We further remove Europe to see trends for emerging regions.
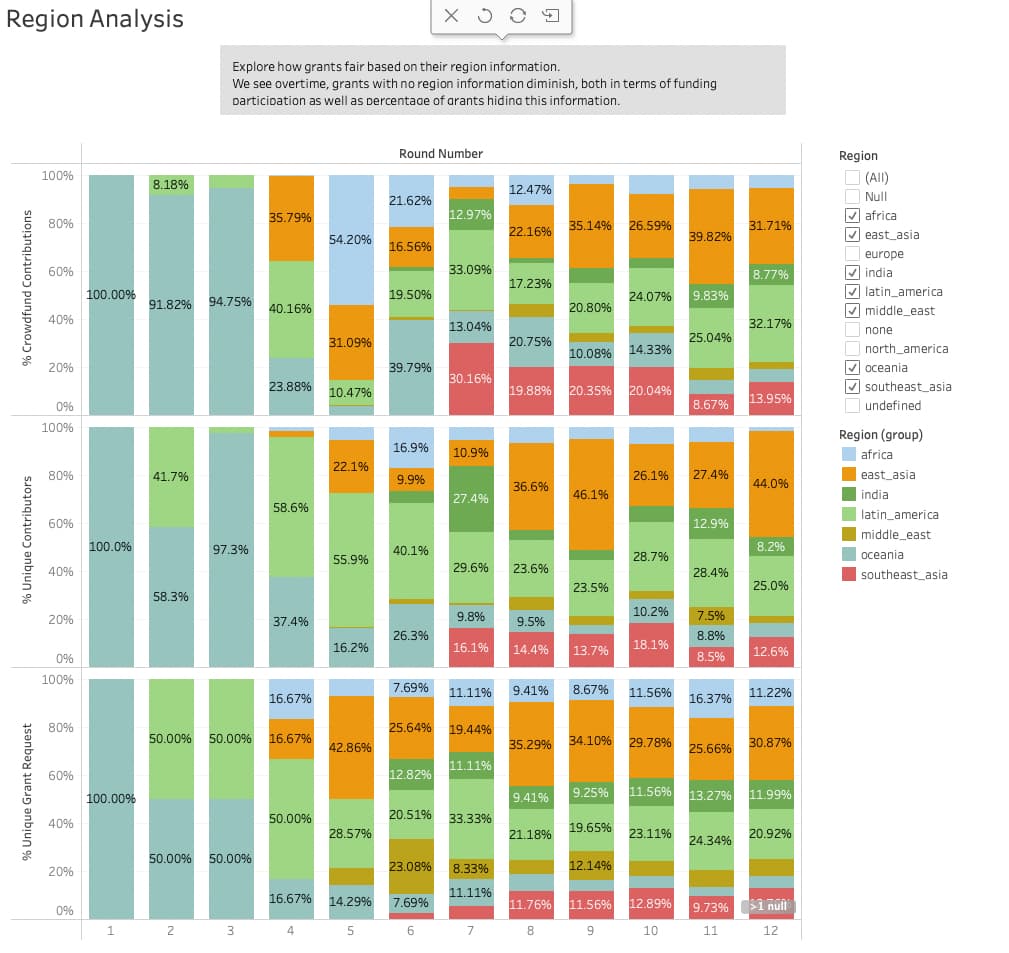
Multiple parts of Asia show interest in creating new grants (hence developing new projects and growing the eco-system).
Latin America and East Asia are leading here, but that could be the region specific grants allocated by the platform in later rounds.
India and Southeast Asia are two strong technological hubs which is now showing active web3 interest.
Africa though is on a decline, despite grant reserves for the region. Could the reserved pool require more appropriate allocation?
2. Region-Category Trends
2.1 The Default View
We’ve removed the field showcasing number of grants and added total contributions received in grants.
2.2 North America - The trend indicator
The first wave of projects are obviously built to support the tech.
Then the next wave projects were supporting the platform itself and community to promote the eco-system.
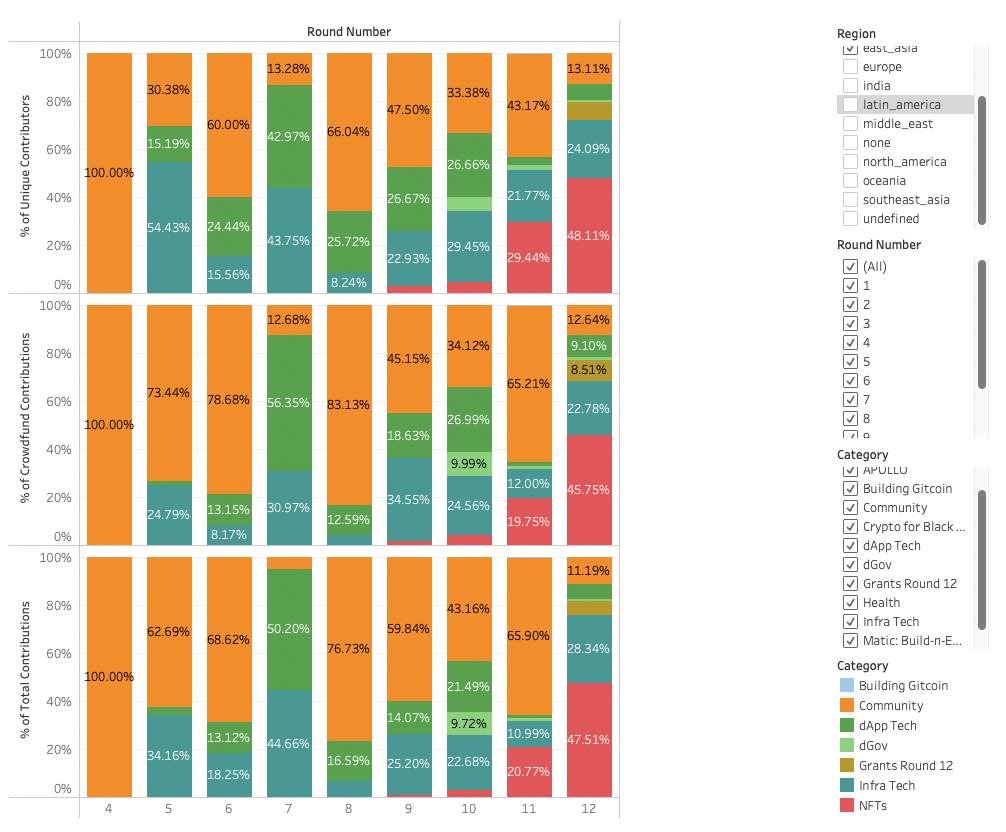
2.3 East Asia - The NFT run
There’s a clear increase in NFT projects from east asia in last 3 rounds. One could promote the NFT DeFi Apps here.
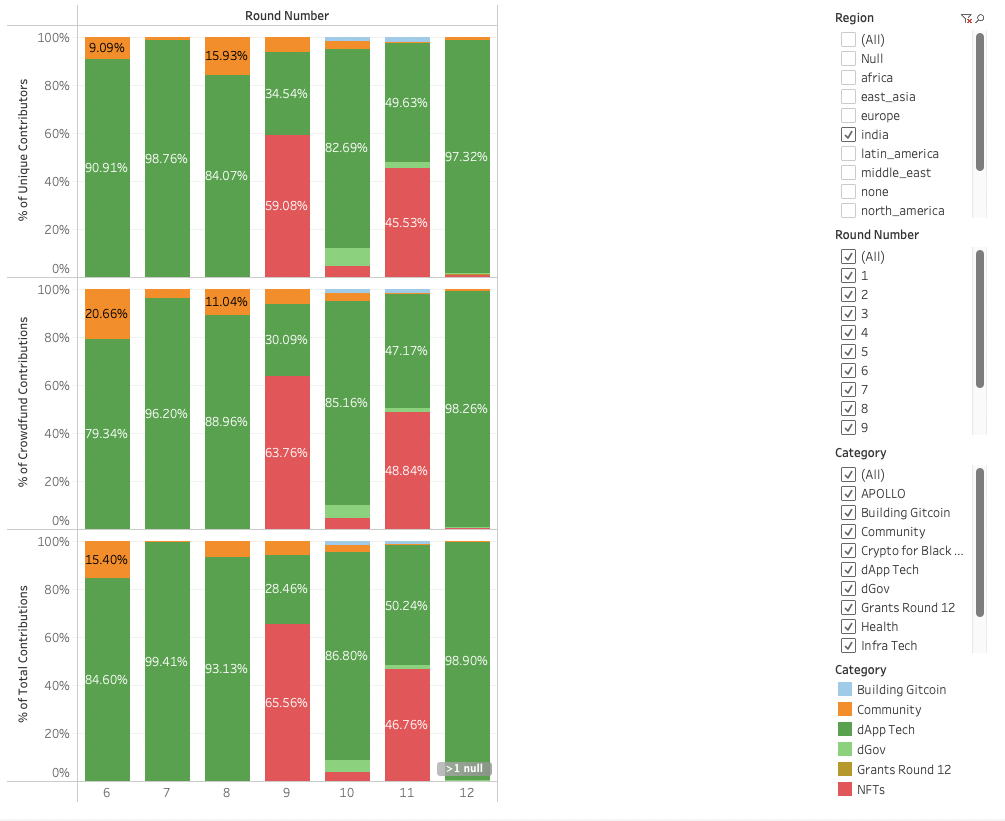
2.4 India - The ground unknown
The Region is still not showing a clear trend other than being capable of producing tech, which, given it’s IT resource pool, shouldn’t be a surprise.
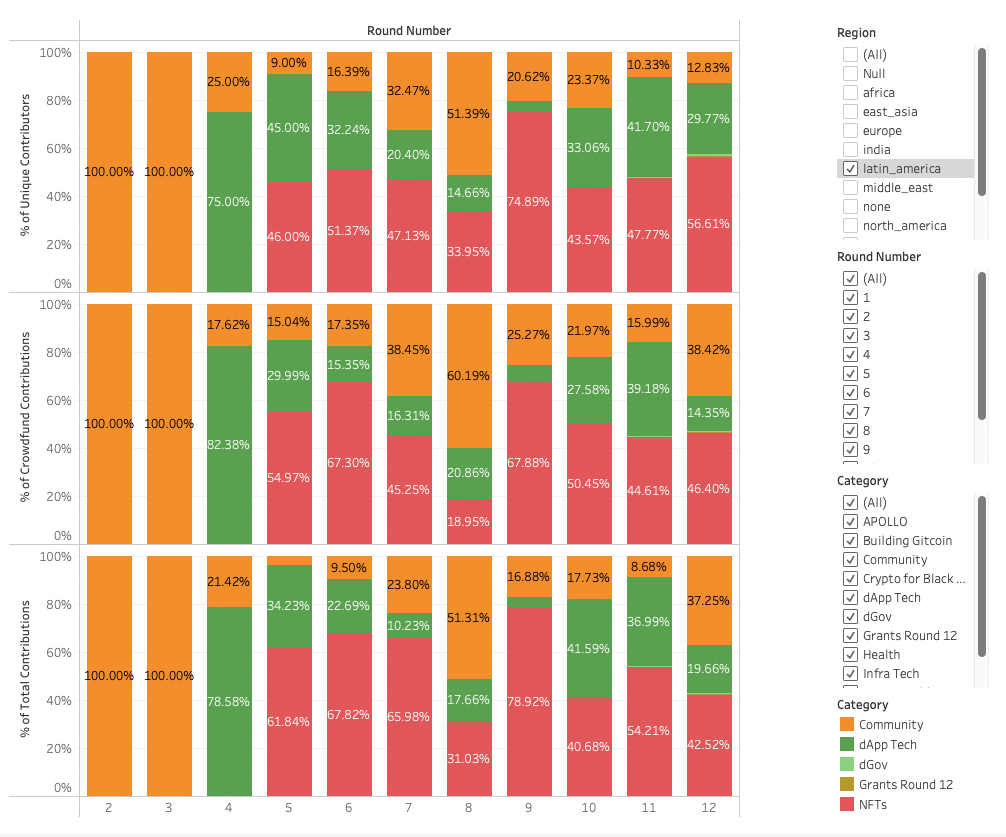
2.5 Latin America
Latin America still looks mostly driven by community and artist, and might be a good space for engineers to find work.
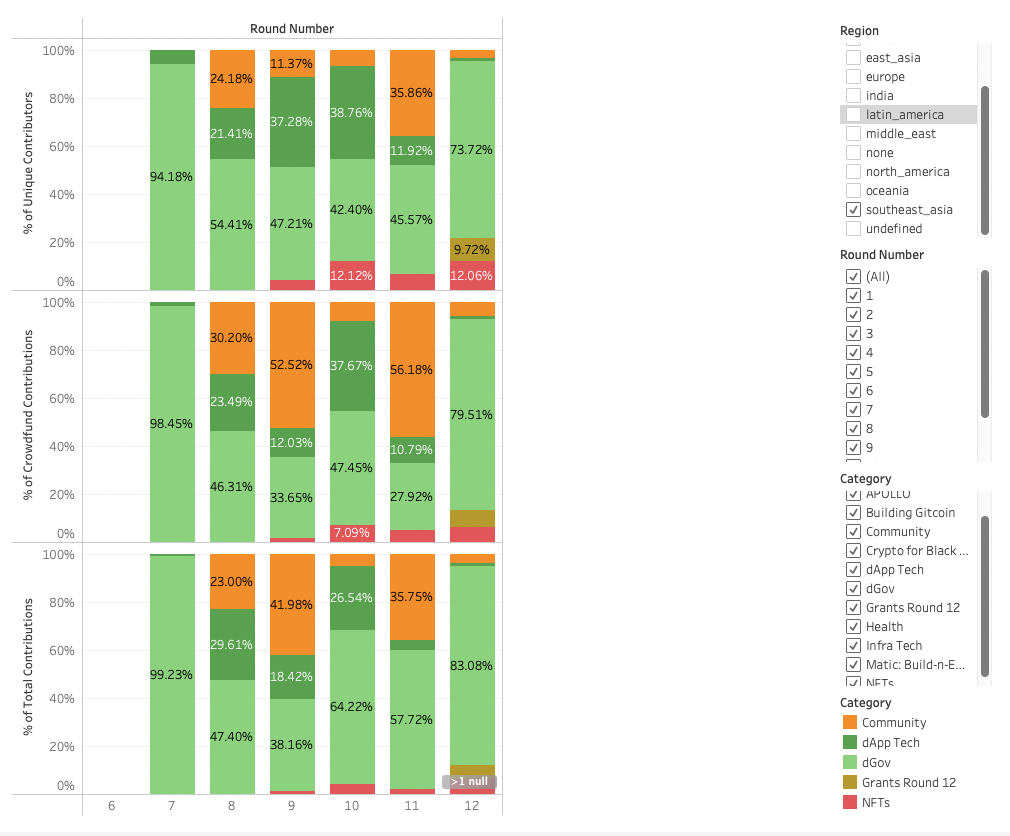
2.6 South East Asia
South East Asia is showing majorly showing the rise for decentralised and community projects. Maybe could be good places to promote green and regenerative projects.
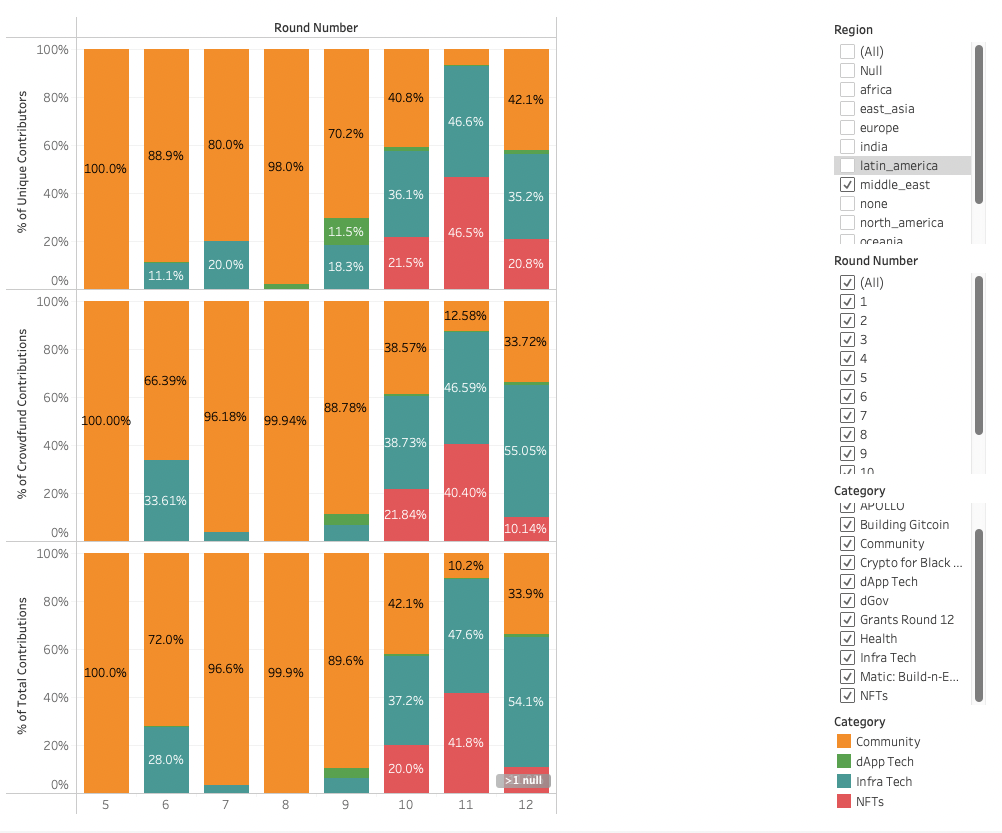
2.7 Middle East
Middle East is not showing any Governance Tokens. Is this because of they their culture is? Would centralized projects do well here? Or is the governance yet to be introduced?
2.8 Health Needs special exploration?
All Health Based Projects are With Missing Region
There is no new grant since round 7. Does this hint at a whole industry not adequately addressed using decentralised technology currently?
Extension & Future Scope
There was thoughts around figuring out more patterns based on the textual content available, which couldn’t be attempted within the bounty period:
Grant Title Analysis
Since grant titles are first thing read by the crowd, there could be patterns on which titles lead to more or less crowd curiosity. Sample features to explore could be:
Grant Description Analysis
Once the Title/Thumbnail triggers a clickthrough, the project description is key to selling the concept and secure a backer. A web scraper can be used to scrape the grant’s page for description text/media and analyse it. The features could be: