Late reply here, but we’ve been hard at work getting data from off-chain CEXs added to the dashboard. This has proven to be harder than we anticipated, however we are now able to track sales from contributor addresses across all of the major CEXs which has been a big milestone.
I think you misunderstood my previous post; we could not find a correlation with our current data and methodology. Not being able to prove a hypothesis does not necessarily mean that the opposite is true.
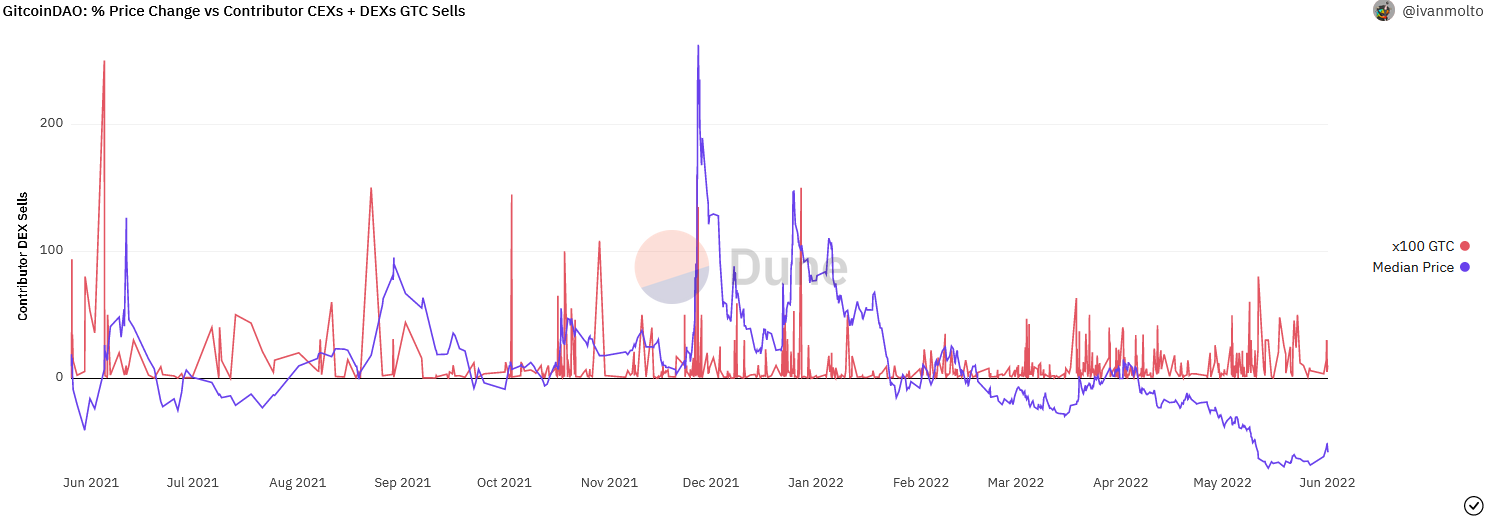
Circling back to sell pressure from contributors;
We’ve recently added a graph over relative GTC price vs daily total contributor sales (DEX+CEX).
(A correlation analysis has not yet been initiatied at this point):
Even though we are now able to track contributor sales on CEXs we’ve yet to find a way to get accurate total CEX volume into the dashboard. Until we have this data available natively in Dune I’ve grabbed the daily volume (CEX+DEX) from Coinmarketcap and Coingecko and plotted this graph:
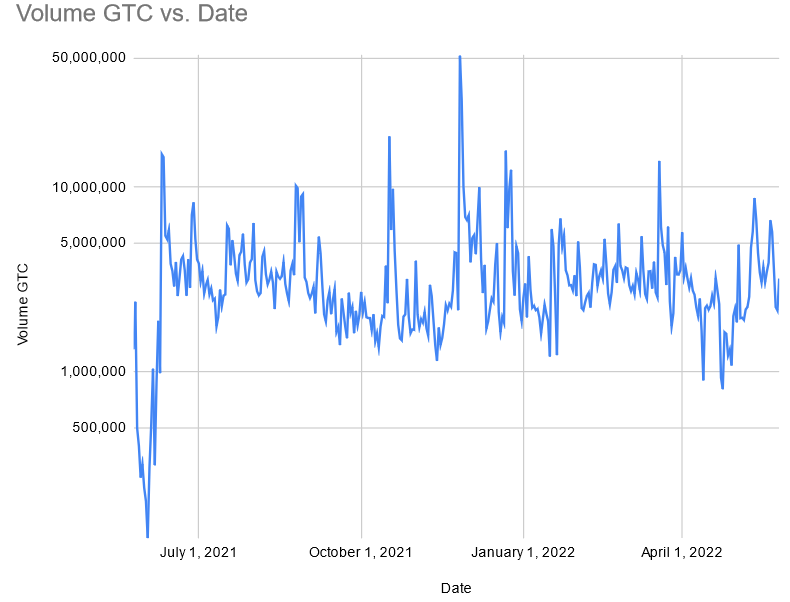
The volume has stayed between 1M - 10M GTC per day for the majority of GTC’s history.
Median GTC volume according to Coinmarketcap = 2.7M GTC/day.
Median GTC volume according to Coingecko = 2M GTC/day.
This is the graph of total GTC sales from contributors on DEX & CEX:
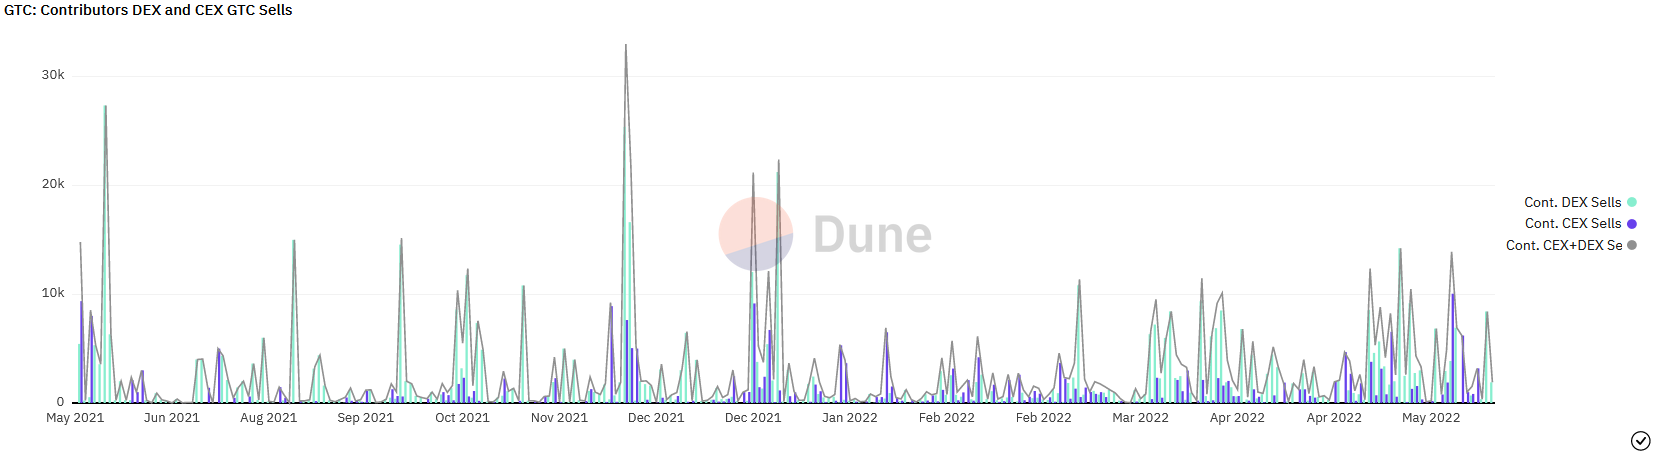
Even on days of relatively large GTC sales from contributors, 10k GTC/day, contributor sell pressure is still less than half a percent of the median daily volume.
(10k GTC/day is roughly equivalent to the 90-95th percentile. A normal distribution graph of contributor sell pressure is in the works. This will allow you to grab any percentile of contributor sell pressure and compare that to the total daily volume.)
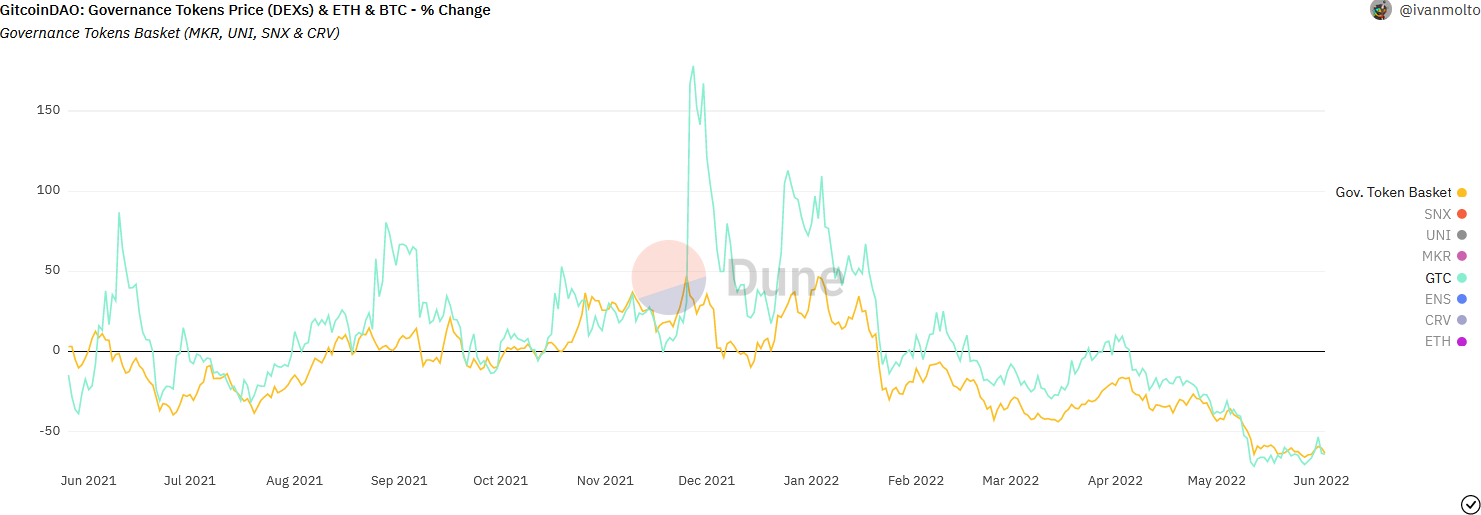
I think you’ve misunderstood the governance token part of the dashboard as well. We are comparing GTC to other governance tokens, which are all down vs ETH.
For convenience we’ve now grouped together other governance tokens into a basket on the graph. Although we haven’t initiated a proper correlation analysis to define the strength of the association, a correlation is clear:
As stated earlier, the dashboard will receive continuous updates as we are able to track more data. I’d be happy to continue the conversation and discuss things further if you are interested in helping out!
(Please note that Dune is performing internal upgrades at the moment and some graphs will not load properly until this work has been completed. The dashboard may also be slower to load)