That wasn’t the case though in S13. And that has had a big impact on budgets.
Here are some numbers I pulled together, with links to my source sheets. I would love to see your source sheets so we can be more transparent about how we generate these charts.
I’m not sure what story you feel this explains? FDD is a wild anomaly when comparing across seasons. It was the only workstream to have reserves approved in S13, and now looks like it is requesting much less in S14 simply because 1) it has reserves from S13 and 2) other workstreams are now playing catchup and requesting reserves for the first time.
I am really pretty saddened by this analysis and it makes me questions how else FDD has been counting and analyzing things. There is no consideration for price at transfer (we have the Tx’s we can look at), those with reserves and those without or the duration of budgetary timeline (PGF, Dao Ops having one extra month of operation spend against their S13 budgets).
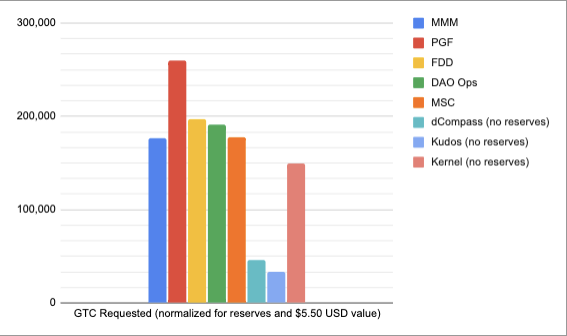
Here is a quick graph showing how different things things actually look if we normalized for a few of the things I called out (to the best of my layman’s ability). Interestingly, most of the workstreams all have a very similar request amount with the exception of PGF. No judgement here - I have always encouraged workstreams to ask for what they need to be successful but to focus on actually being successful (stop over committing and under delivering when you get a blank check).
I am working on a few more graphs to share, but I am doing my best to make the data available linked above if someone wants to beat me to it.
edit Here are a few more (again using the spreadsheet linked above).
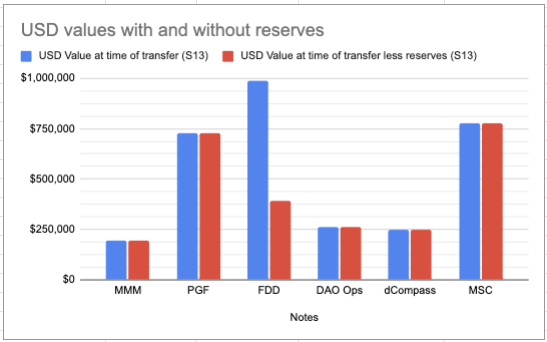
We can see that the reserves for FDD put it far above everyone else, but this was something we have normalized for S14. But without normalizing and excluding reserves, it paints a very different picture on where funding is going (in an unfair way).